

$13.5T Total — Bank Loans in the United States 2026
US Bank Loans Report 2026Contents In This Report Overview Total Bank Loans Household Debt Mortgage Lending Consumer Credit Commercial & CRE Delinquency & Risk Key Statistics Outlook FAQ …
Statistics and data on Financial Services within Finance & Insurance. Every chart names its original source and publication date.
Statistics
Newest first. Every chart names its original source and publication date.
US Bank Loans Report 2026Contents In This Report Overview Total Bank Loans Household Debt Mortgage Lending Consumer Credit Commercial & CRE Delinquency & Risk Key Statistics Outlook FAQ …

Australia Payments Report 2026Contents In This Report Overview Trust Rankings Digital Wallets & Mobile Buy Now Pay Later Real-Time Payments Key Statistics Forecast 2028 FAQ Financial MarketsDigital PaymentsAustralia2026 …
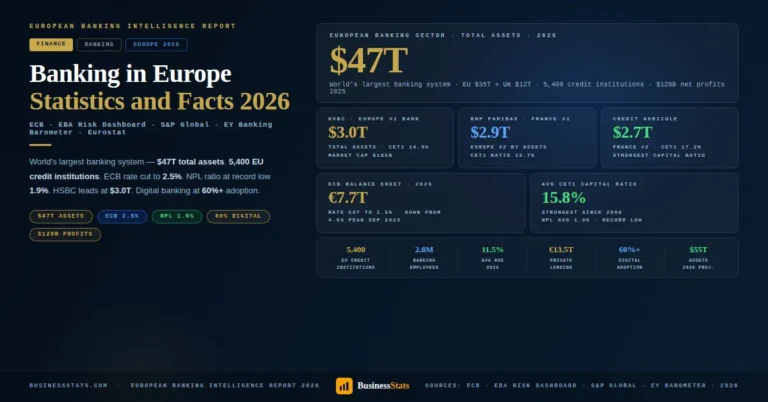
Banking in Europe 2026 Contents In This Report Overview Top Banks by Assets ECB & Monetary Policy Capital & NPL Ratios Digital Banking Country Rankings Key Statistics Forecast …
Fintech in Europe 2026 Contents In This Report Overview Market Size 2017–2032 Top Fintech Hubs European Unicorns Open Banking Neobanks Investment Trends Key Statistics Forecast 2032 FAQ Finance …
Fintech Report 2026 Contents In This Report Overview Market Size 2017–2032 Market Segments Fintech Unicorns Regional Breakdown Digital Payments Key Statistics Forecast 2032 FAQ Finance Fintech Digital Payments …
More topics
Financial Services is one of 4 topics in Finance & Insurance. The other topics complete the picture with their own indicators and sources.
Our standards
More categories