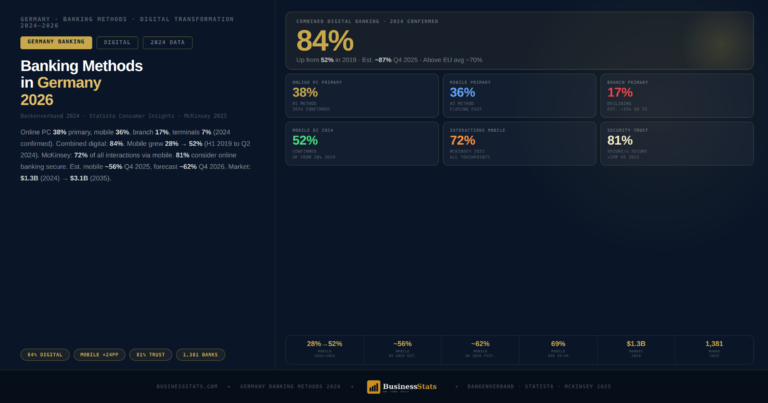
Germany Banking Methods 2026 — Online 38%, Mobile 36%
Germany Banking Methods 2026 Contents Jump To Section Primary Methods Chart Quarterly Trend 2019-Q4 2025 Age Group Breakdown Online Services Used Mobile Banking Growth Branch Decline Trust and …
Statistics and data on Financial Institutions within Finance & Insurance. Every chart names its original source and publication date.
Statistics
Newest first. Every chart names its original source and publication date.
Germany Banking Methods 2026 Contents Jump To Section Primary Methods Chart Quarterly Trend 2019-Q4 2025 Age Group Breakdown Online Services Used Mobile Banking Growth Branch Decline Trust and …
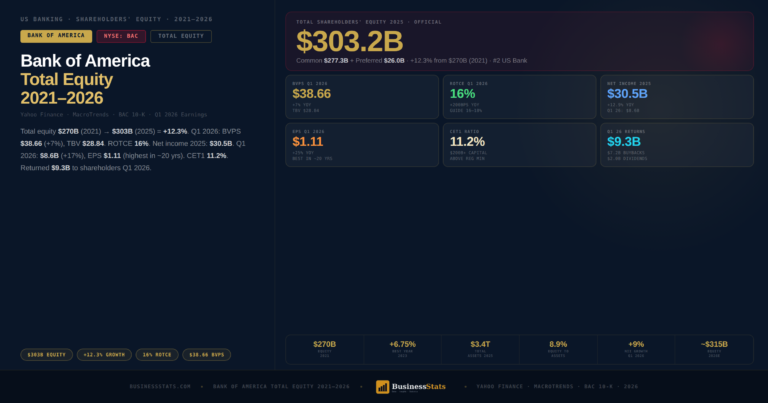
Bank of America Total Equity 2021–2026 Contents Jump To Section Total Equity 2021–2026 Common vs Preferred Equity Book Value Per Share Net Income & ROTCE Q1 2026 — …

Investment Banking Revenue 2026 Contents Jump To Section Global IB Revenue Overview Fee Pool Trend 2019–2026E JPMorgan Chase — #1 Goldman Sachs — #2 Morgan Stanley — #3 …

Largest Banks in the UK 2026 Contents Jump To Section Full Assets Ranking HSBC – #1 Barclays – #2 Lloyds – #3 NatWest – #4 Standard Chartered – …

Fed Funds Rate 1954–2026 Contents In This Report Overview Historical Timeline Volcker Era (1979-1987) Modern Era (2000-2019) 2022-23 Hike Cycle Key Statistics 2026 Outlook FAQ Sources Monetary PolicyFederal …

iShares ETF Report 2026Contents In This Report Overview Scale & Market Share Top Funds Bond ETFs Digital Assets Active ETFs Competitive Landscape Key Statistics Outlook FAQ FinanceETFsAsset Management2026 …

BlackRock AUM Report 2026Contents In This Report Overview AUM Breakdown Equity — $7.8T Fixed Income — $3.3T Alternatives — $423B Fee Economics Net Flows Key Statistics Outlook FAQ …

Green Banking Report 2026Contents In This Report Overview Market Size Green Bonds Regional Breakdown ESG Integration Sovereign Issuers Key Statistics 2030 Outlook FAQ FinanceGreen BankingESG2026 Data Green Banking …
Central Banks Intelligence Report 2026 Contents In This Report Executive Summary Fed Rate History Chart Policy Rates — All 12 Banks Balance Sheet Comparison Inflation by Region G4 …
More topics
Financial Institutions is one of 4 topics in Finance & Insurance. The other topics complete the picture with their own indicators and sources.
Our standards
More categories