
Travel, Tourism & Hospitality: statistics and facts
This collection of 20 reports follows travellers from the airport to the hotel and the restaurant table. Business Travel profiles corporate trips in Europe, the US and Japan. Tourist Destinations ranks the most visited cities and countries, and Tourism Markets looks at online travel, domestic trips and outbound flows.
Hotels and Accommodation covers Germany and Canada, while Restaurants and Food Service tracks big chains and the US pizza sector. Popular reads include the most visited cities ranking, the online travel market forecast and annual Starbucks revenue. Updated Nov 8, 2026 for planners, investors and students.
- 20reports
- 5sections
- 1sub-topics
- last update
Sub-topics
Editor picks

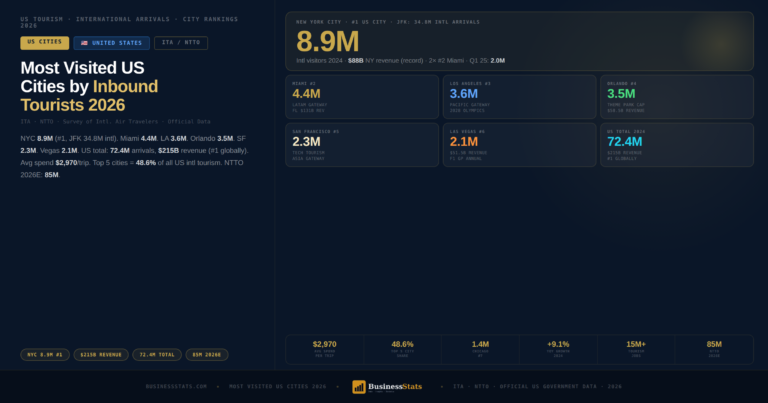
Business Travel
7 reports- Business Travel in Europe 2026: EUR 389.9B Spend, RankedSep 29, 2026EUR 389.9BEurope Spend 2026F
- Business Travel in the US Statistics & FactsMay 30, 2026USD 370BBusiness Travel Spend
- Business Travel in the UK — Statistics & FactsMay 30, 2026GBP 28.4BBusiness Travel Spend
- Business Travel in Japan — Statistics & FactsMay 30, 2026JPY 22.8TBusiness Travel Spend
- Business Travel in Italy — Statistics & FactsFeb 28, 2026EUR 28.6BBusiness Travel Spend
- Business Travel in France -Statistics & FactsMay 30, 2026EUR 32.4BBusiness Travel Spend
- China Exhibition Industry 2026: 3,844 Fairs, 155M sqm SpaceSep 29, 20263,844Trade Exhibitions 2024
Tourist Destinations
3 reportsTourism Markets
3 reports- Online Travel Market Size Worldwide 2017–2030 $521B to $1.57T | Statistics & FactsMay 30, 2026$521BGlobal Online Travel Market Size 2023
- How Much Do Europeans Travel Abroad, and Where Does the Money Go?Nov 7, 20261.20BEU Trips, 2025
- How French Residents Holiday at Home: Trips, Nights, Regions and SeasonsNov 7, 2026195.9MTrips Within France, 2025
Hotels and Accommodation
2 reportsRestaurants and Food Service
5 reports- Which Airports Are the Busiest in the World? 2025 Rankings by Passengers, Cargo and FlightsNov 8, 2026106.3MAtlanta Passengers, 2025
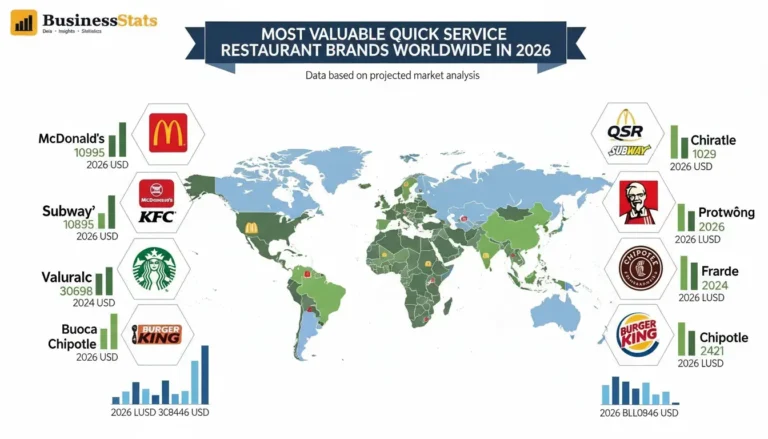
- Most Valuable Quick Service Restaurant Brands Worldwide in 2026May 30, 2026$52.7BMcDonald's Brand Value #1
- McDonalds Revenue History From the Form 10-K Filings, 2005 to 2026Nov 7, 2026$26.89BFY2025 Revenue
- Starbucks Revenue 2003–2026 — Annual Sales Statistics & FactsMay 30, 2026$37.2BFY2025 Annual Revenue
- Pizza Restaurant Industry Market Size in the United States — 2024 & 2026May 30, 2026$50.1BMarket Size 2024
No statistic matches your search.
Every report is free to read, with its sources, charts and data download.