

Big Tech Revenue Comparison 2026: $2.28T, Margins, AI Capex
Big Tech Compared 2026 Contents In This Report Fiscal Calendars Revenue Ranking Share of the Group Ten Years of Revenue Latest Quarter Operating Margins Net Income AI Capex …
Statistics and data on Technology & Digital. Every chart names its original source and publication date.
Statistics
Newest first. Every chart names its original source and publication date.
Big Tech Compared 2026 Contents In This Report Fiscal Calendars Revenue Ranking Share of the Group Ten Years of Revenue Latest Quarter Operating Margins Net Income AI Capex …
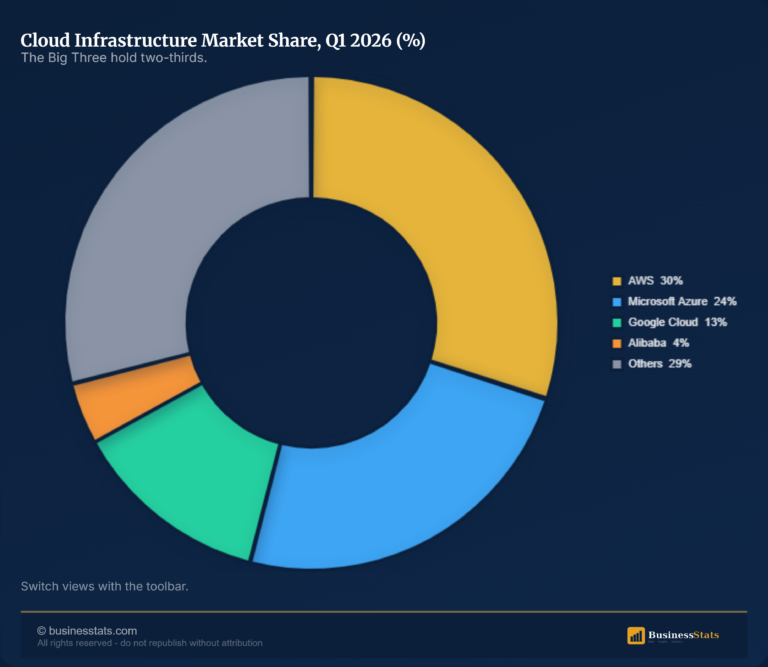
Cloud Market Share 2026 Contents In This Report Overview Provider Table The Big Three Growth Rates Share Over Time Market Size Beyond the Big Three By Region The …
Our standards
More categories