Chemicals & Resources: statistics and facts
This page brings together 15 Business Stats reports on Chemicals & Resources, grouped into Oil (8 reports) and Chemical Industry (3 reports).
Among the figures you will find here: $130 (Brent Record (Mar 2022)), $613B (Annual Output 2025), $67.4B (BASF Sales 2025) and $75/bbl (Brent Crude Q1 2026 Avg).
Most recently revised are Brent, OPEC & WTI Oil Prices 2020–2026 — Weekly Chart and $613B Market — US Chemical Industry Statistics & Facts 2026. Every report names its primary source, and its charts and tables can be downloaded and reused for free. The list grows on its own when a new report is published; it last changed on Oct 18, 2026.
- 15reports
- 3sections
- last update
Editor picks

Oil
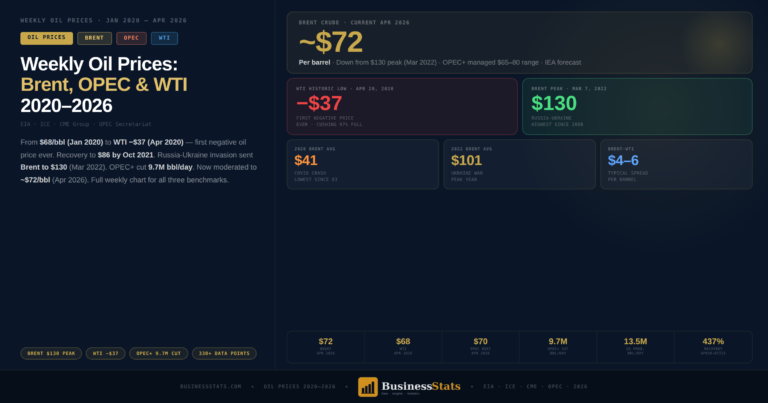
8 reports- Brent, OPEC & WTI Oil Prices 2020–2026 — Weekly ChartJun 18, 2026$130Brent Record (Mar 2022)
- U.S-Iran Talks Failed in Islamabad: Oil Markets Brace for What Comes NextApr 12, 20263.4MIran Barrels/Day Output
- $180B Revenue — Global Oil and Gas Transportation Industry 2026Jun 13, 2026$180BAnnual Midstream Revenue 2025
- Global Oil and Gasoline Prices — Statistics & Facts 2026Jun 13, 2026$75/bblBrent Crude Q1 2026 Avg
- 103.3M bbl/d — Global Oil Refinery Industry 2026Jun 13, 2026103.3MBbl/Day Global Refining Capacity
- 1.1T Revenue — Oil Industry in the Middle East 2026Jun 13, 202631.5MBarrels/Day Production 2025
- Global Oil Industry — Statistics & Facts 2026Jun 13, 2026102.2MBarrels per Day Production 2025
- Global Oil Reserves by Country (1960–2024) — Statistics & FactsMay 30, 20261,567BTotal Proven Reserves 2024 (Barrels)
Chemical Industry
3 reportsMore statistics
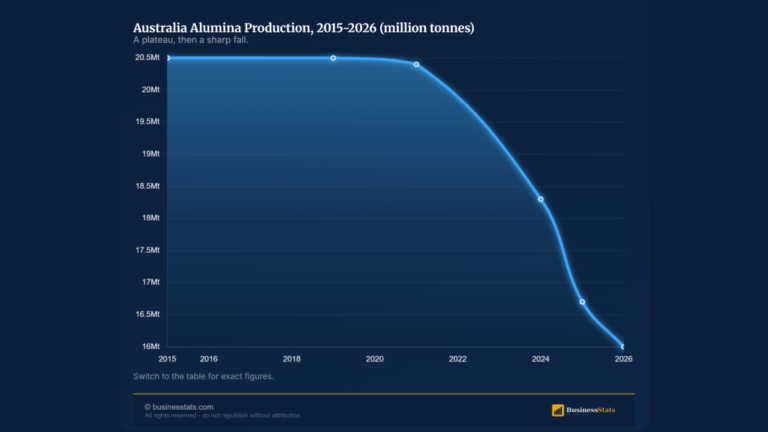
4 reports- Australia Alumina Production 2015 to 2026: Data and TrendsSep 16, 202616.7MtOutput 2025
- Silver Demand by End Use 2026 (Ranked)Sep 8, 202658%Industrial
- Gasoline and Diesel Market in Europe 2026: Statistics & FactsApr 13, 2026€1.871EU Avg Petrol /L (Apr 2026)
- Top Chemical Companies 2026: BASF Leads With $67.4B SalesOct 12, 2026$67.4BBASF Sales 2025
No statistic matches your search.
Every report is free to read, with its sources, charts and data download.