
Closing price of Brent, OPEC basket, and WTI crude oil at the beginning of each week from January 6, 2020 to June 18, 2026
The chart below is the primary data visualization - showing weekly closing prices for Brent crude, the OPEC basket, and WTI futures across the entire 2020-2026 period. Click an event label to jump the annotation. The distinct phases are clearly visible: the pre-COVID baseline (~$65-68), the COVID crash (Apr 2020 low), the gradual recovery (May 2020-Dec 2021), the Ukraine spike (Feb-Mar 2022), the managed moderation (2023-2025), and the dramatic 2026 Iran War spike that drove Brent back toward $120 before its June 2026 retreat.
The chart tells a story of extraordinary volatility. The peak-to-trough swing from January 2020 ($68/bbl Brent) to April 2020 (WTI briefly negative) represents the largest percentage decline in oil price history in such a short time. The 2022 Ukraine spike to $130 and the 2026 Iran War spike to nearly $120 then bookended a period of OPEC+ managed stability. The 2026 surge - Brent rising roughly 55% in weeks as the Strait of Hormuz closed - was, by supply-disruption volume, the largest in the history of the oil market. The broader financial context of commodity markets is tracked in our U.S. financial markets analysis.
The 2020 COVID Oil Price Crash - WTI Goes Negative
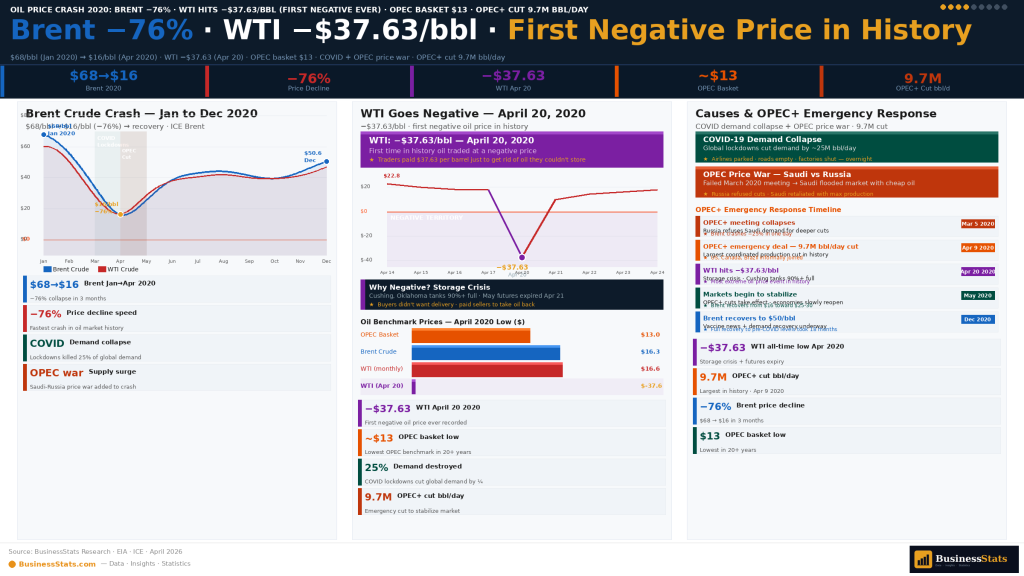
The oil market entered 2020 in a relatively stable position - Brent trading at approximately $68/barrel, WTI at approximately $63/barrel, and the OPEC basket at approximately $65/barrel in the week of January 6, 2020. The first warning signs of COVID-19's economic impact appeared in late January as Chinese demand data deteriorated. By early March 2020, the oil market faced a double shock that would prove devastating.
- Shock 1 - COVID demand destruction: Lockdowns in China (Jan-Feb 2020), then Europe and the USA, collapsed global oil demand by approximately 25-30 million barrels per day - the largest demand shock in oil history
- Shock 2 - OPEC price war: On March 6, 2020, Saudi Arabia and Russia failed to agree on supply cuts at an OPEC+ meeting, triggering a deliberate price war - Saudi Arabia announced it would increase production to flood markets
- Brent March 9, 2020: Fell from $51 → $31 in a single day - largest single-day drop since 1991 Gulf War
- WTI April 20, 2020: Front-month futures hit −$37.63/barrel - first time in history any major oil benchmark traded below zero
- Brent April 2020 low: ~$16/barrel - a 76% decline from January 2020 levels
On April 20, 2020, WTI crude oil front-month (May) futures briefly touched −$37.63 per barrel - meaning buyers had to be paid $37 to take delivery of oil. This extraordinary event had a simple but unprecedented cause: the Cushing, Oklahoma storage hub (where WTI is delivered) was 97% full. Traders holding futures contracts expiring the next day faced a choice - take physical delivery of oil they had nowhere to store, or sell at any price. Panic selling briefly pushed the price below zero. Importantly, the June futures contract and Brent crude never went negative - they continued trading around $20-25/barrel. The spot price recovered to positive territory the very next day. The event highlighted the structural difference between paper trading and physical commodity markets, and why Brent (settled in cash, not physical) is often considered a more reliable price signal than WTI. The oil company financial impacts connect to our analysis of the world's most valuable companies.
The OPEC+ price war that amplified the COVID shock was short-lived - facing the reality of economic devastation, Saudi Arabia and Russia agreed to historic production cuts in April 2020. The agreement - cutting approximately 9.7 million barrels per day (roughly 10% of global pre-pandemic production) - was the largest OPEC production cut in history and was critical to stabilizing prices above zero. The cuts provided the floor that allowed the recovery to begin. Countries that depend on oil revenues are analyzed in our global GDP analysis.
- April 2020 OPEC+ cut: 9.7 million barrels/day removed - largest in history
- Price floor: WTI stabilized ~$15-20/bbl by late April · Brent ~$18-22/bbl
- Why Brent stayed positive: Brent is cash-settled and North Sea production flexible - no Cushing storage problem
- Brent-WTI spread April 2020: Widened to $10+ as WTI distorted by storage crisis
The Oil Price Recovery - May 2020 Through December 2021
The recovery from the April 2020 lows was gradual at first, then accelerating. From a Brent low of approximately $16/barrel in late April 2020, prices climbed steadily as OPEC+ production discipline held, COVID vaccines began rolling out in late 2020, and global economic reopening gathered pace. By October 2021, Brent had reached approximately $86/barrel - a remarkable 437% recovery from the April 2020 low in just 18 months, and 26% above the pre-COVID January 2020 price.
- May-Dec 2020: Brent recovered from $16 → $51 (+219%) as OPEC+ cuts held and demand slowly recovered
- Jan-Mar 2021: Vaccine rollouts accelerate · Brent crosses $60/bbl for first time since March 2020
- June 2021: Brent hits $75/bbl · OPEC+ begins gradual production restoration
- Oct 2021: Brent reaches $86/bbl · Energy crisis in Europe drives demand for oil as gas substitute
- Dec 2021: Omicron variant briefly knocks prices down to ~$68 before recovery
- Key driver: OPEC+ production discipline - Saudi Arabia led unprecedented market management
The 2021 recovery was faster and stronger than most analysts predicted. Three factors drove the speed: OPEC+ kept cuts in place longer than markets expected; the U.S. shale industry - which had previously acted as a "swing producer" that would ramp output when prices rose - was constrained by capital discipline and ESG investor pressure, meaning the usual supply response to higher prices was muted; and pent-up travel demand exploded once vaccines were widely available in developed markets. Jet fuel and gasoline demand recovered particularly fast. Oil companies that benefited from this recovery are covered in our most valuable companies report.
The 2022 Ukraine Price Spike - Brent Hits $130
Oil prices were already elevated at approximately $85-90/barrel (Brent) entering 2022, driven by tight global supply and strong post-pandemic demand. Then on February 24, 2022, Russia launched its full-scale invasion of Ukraine - and oil markets went into shock. Within 11 days, Brent crude surged from $97/barrel to a peak of approximately $130/barrel on March 7, 2022 - the highest price since July 2008 and a level almost no analyst had forecast.
- Feb 24, 2022: Russia invades Ukraine · Brent opens at ~$97 · immediately surges
- Mar 7, 2022: Brent peaks at ~$130/bbl · WTI at ~$124/bbl · OPEC basket ~$126/bbl
- Cause: Russia exports ~10M barrels/day (second largest globally) · sanctions threat removed supply
- EU response: Russian oil embargo announced · buyers scrambling for alternative supply
- IEA emergency release: Coordinated 60M barrel strategic reserve release announced March 2022
- Price by June 2022: Still ~$120/bbl - supply constraints persisted
- H2 2022 decline: Recession fears + demand destruction + Russian oil rerouted → prices fell to ~$80 by Dec 2022
The price ultimately proved unsustainable at $120-130/barrel - demand destruction set in as consumers and businesses cut consumption. Russian oil was not removed from the market but rerouted: China and India became massive buyers of discounted Russian crude, often via intermediaries. By the end of 2022, Brent had retreated to approximately $80/barrel - still significantly above pre-war levels but far below the March peak. The war's impact on energy markets and global economies is analyzed in our global GDP report. The energy sector's financial market dynamics are tracked in our U.S. financial markets analysis, which covers oil futures, commodity ETFs, and energy sector equities.
Annual Average Oil Prices - Brent vs WTI 2020-2026
The grouped bar chart below compares annual average Brent and WTI prices. The 2022 spike is clearly a dominant feature - with Brent averaging $101/barrel for the full year. The 2026 figure is a part-year average lifted sharply by the Iran War: after starting near $72, Brent spiked toward $120 in March and April, pushing the 2026-to-date average to roughly $92/barrel despite the June retreat.
From OPEC+ Management to the 2026 Iran War & Strait of Hormuz Crisis
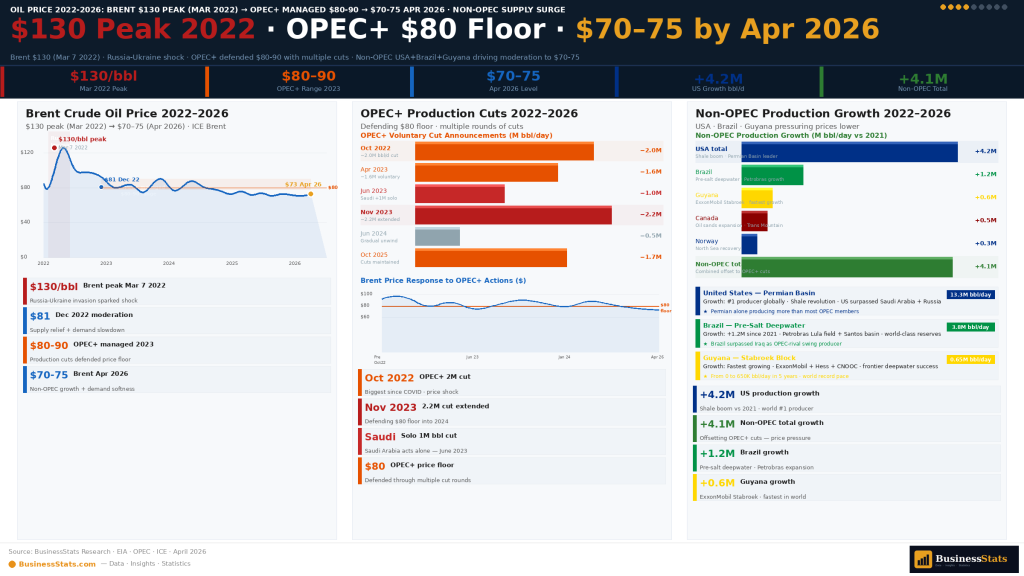
From mid-2022 through 2025, OPEC+ operated in active price management mode - repeatedly cutting production to defend a $70-90/barrel range. This produced a period of relative calm: Brent averaged around $82 in 2023, $80 in 2024, and roughly $76 in 2025, while growing non-OPEC supply from the United States, Brazil, and Guyana kept a lid on prices. Entering 2026, Brent sat near $72/barrel and most forecasters expected a quiet, mildly oversupplied year. That calm was shattered in February 2026.
- 2023-2024: OPEC+ defends $80-90 · Brent avg $82 (2023), $80 (2024)
- 2025: Brent ~$76 avg · mild oversupply · steady non-OPEC supply growth
- Late Feb 2026: U.S. and Israel launch military operations against Iran · Brent ~$72
- Mar 4, 2026: Iran declares the Strait of Hormuz closed · ~20% of global oil supply disrupted
- Mar-Apr 2026: Brent surges past $100, peaks near $120 · Dubai crude hits $166 record
- May-Jun 2026: Ceasefire talks · Brent falls ~19% in May · June peace deal · Brent ~$78
The 2026 Iran War triggered the largest oil supply disruption in market history. After U.S. and Israeli strikes on Iran in late February, Iran declared the Strait of Hormuz - through which roughly 20% of the world's oil and about 25% of seaborne crude trade passes - closed on March 4. Tanker traffic collapsed to near zero, Middle East production fell by more than 11 million barrels per day at the peak, and the IEA called it "the largest supply disruption in the history of the global oil market." Brent surged from $72 in late February to surpass $100 on March 8 and approach $120, while Dubai crude hit a record $166 on March 19. The crisis and its economic fallout connect to our global GDP analysis.
On March 4, 2026, following U.S. and Israeli military operations against Iran, Iranian forces declared the Strait of Hormuz closed and began attacking vessels. The strait carries roughly 20% of global oil supply and 25% of seaborne crude trade, with about 84% of those flows bound for Asia. Tanker traffic collapsed, QatarEnergy declared force majeure on exports, and Gulf production fell by over 11 million barrels per day. Brent crude rocketed from $72 to nearly $120, Dubai crude touched a record $166, and the IEA released 400 million barrels from emergency reserves - about four days of global consumption. After repeated ceasefire attempts, the U.S. and Iran signed an interim peace deal in mid-June 2026, reopening the strait. Brent fell roughly 38% from its peak to around $78 by June 18, 2026, though analysts warn damaged infrastructure and depleted inventories will keep the market tight for months. The corporate impacts connect to our most valuable companies analysis.
With the strait reopening in June 2026, attention has shifted from shortage to a looming glut. The IEA now projects global oil supply could rise by 8 million barrels per day by 2027 against demand growth of just 2 million, as Saudi Arabia, the UAE - which left OPEC during the conflict - Iraq, and Iran restart halted output. Goldman Sachs cut its Brent forecast to $80 for the fourth quarter of 2026, while the EIA expects Brent to average around $105 in June and July before easing toward $79 in 2027. U.S. record production of about 13.5 million barrels per day adds further downward pressure once Gulf flows normalise. Oil-revenue wealth in the Gulf is tracked in our wealth distribution analysis.
Key Oil Price Events Timeline - 2020 to 2026
The event timeline below explains each major price movement visible in the chart. Reading these alongside the chart above gives the full picture of why prices moved when they did.
Understanding the Three Benchmarks - Brent, WTI & OPEC Basket
The three benchmarks in this dataset serve different purposes in global oil pricing. Brent crude - extracted from the North Sea - is the most widely used global benchmark, pricing approximately 70% of internationally traded crude oil. WTI (West Texas Intermediate) is the primary benchmark for North American oil, trading on the NYMEX exchange in New York. The OPEC Reference Basket (ORB) is a weighted average of petroleum blends from OPEC member countries - used primarily to track OPEC member revenues and production incentives.
Brent vs WTI - Price Spread History 2020-2026
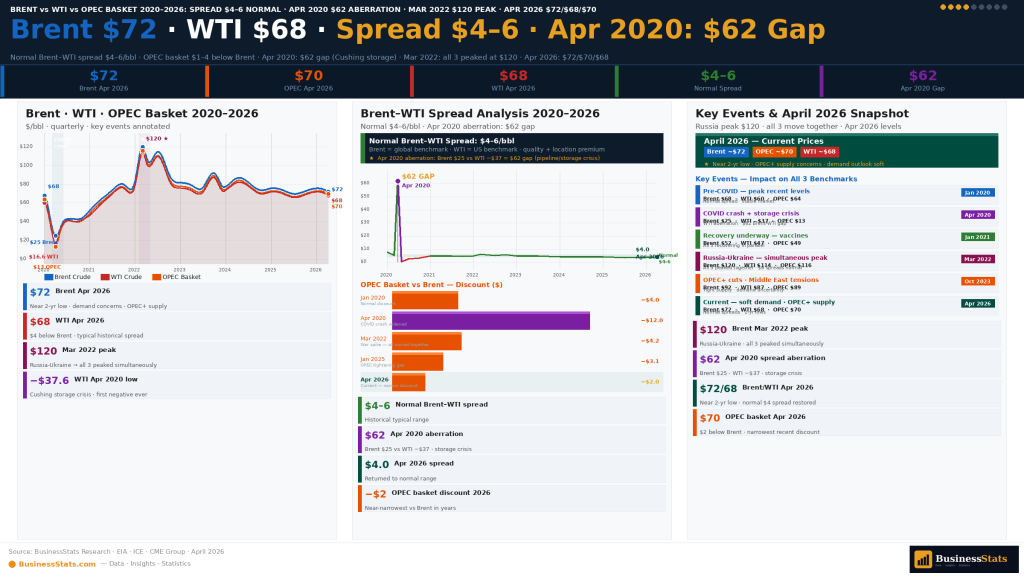
- Normal Brent premium: $3-6/barrel above WTI - reflects quality and transport cost differences
- April 2020 exception: WTI briefly −$37 while Brent +$25 → artificial spread of $60+ due to Cushing storage crisis
- OPEC basket: Typically $1-4 below Brent · contains some heavier, higher-sulfur blends that trade at a discount
- 2022 & 2026 spikes: All three benchmarks moved together - geopolitical shocks affected global supply equally
- Jun 2026 spread: Brent ~$78 · WTI ~$75 · OPEC basket ~$76 - narrowed to ~$3 after the war premium faded
Oil Prices 2020-2026 - Key Statistics & Facts
Frequently Asked Questions - Oil Prices 2020-2026
The highest oil price in the 2020-2026 period was reached on March 7, 2022, when Brent crude briefly touched approximately $130 per barrel following Russia's invasion of Ukraine. The 2026 Iran War came close, with Brent reaching nearly $120/barrel in March-April 2026 when the Strait of Hormuz closed, while Dubai crude hit a record $166/barrel on March 19, 2026. Both events were triggered by major supply shocks, but the 2022 Ukraine peak remains the highest Brent print of the period.
WTI (West Texas Intermediate) front-month futures went negative for the first time in history on April 20, 2020, briefly reaching −$37.63 per barrel. This unprecedented event occurred because: COVID-19 lockdowns had collapsed oil demand; U.S. storage facilities at Cushing, Oklahoma were nearly full (97%+ capacity); and traders holding expiring May futures contracts had to pay buyers to take physical delivery of oil they had nowhere to store. Crucially, Brent crude stayed positive throughout (around $25/barrel) because it is cash-settled, not physically delivered. The WTI spot price recovered to above zero the next day.
The 2026 Strait of Hormuz crisis was the largest oil supply disruption in market history. After U.S. and Israeli military operations against Iran began in late February 2026, Iran declared the Strait of Hormuz - through which roughly 20% of the world's oil and about 25% of seaborne crude trade passes - closed on March 4, 2026, attacking vessels and collapsing tanker traffic. Gulf production fell by more than 11 million barrels per day at the peak. Brent crude surged from ~$72 to nearly $120/barrel, Dubai crude hit a record $166, and the IEA released 400 million barrels from emergency reserves. After repeated ceasefire attempts, the U.S. and Iran signed an interim peace deal in mid-June 2026 and the strait began reopening, sending Brent back down to around $78 - roughly 38% below its peak.
The crash was caused by two simultaneous shocks: (1) COVID-19 demand collapse - lockdowns across China, Europe, and the U.S. destroyed approximately 25-30 million barrels/day of demand within weeks - the largest demand shock in oil history. (2) OPEC price war - on March 6, 2020, Saudi Arabia and Russia failed to agree on production cuts and Saudi Arabia deliberately flooded markets. Brent fell 30% in a single day (March 9). The combination drove Brent from $65/barrel (early January 2020) to below $20/barrel by mid-April - a decline of over 70% in less than four months.
The 2022 price spike was caused primarily by Russia's full-scale invasion of Ukraine on February 24, 2022. Russia is the world's second-largest oil exporter (approximately 10 million barrels of oil equivalent per day). Western sanctions and voluntary corporate withdrawals from Russian oil trade threatened to remove significant supply. Brent surged from $97/barrel on the invasion date to a peak of approximately $130/barrel on March 7, 2022 - a 34% increase in 11 days. Energy prices remained elevated through much of 2022, with Brent averaging $101/barrel for the full year, before gradually declining in H2 2022 as Russian oil found new buyers in China and India.
As of June 18, 2026, oil prices are approximately: Brent crude ~$78/barrel, WTI ~$75/barrel, and the OPEC basket ~$76/barrel - a three-month low. Prices had spiked to nearly $120 during the 2026 Iran War when the Strait of Hormuz was closed, but a mid-June US-Iran interim peace deal reopened the strait and sent crude down roughly 38% from its April peak. With Gulf producers restarting halted output and the IEA warning of a looming supply surplus, markets have shifted from shortage fears toward oversupply, pressuring prices lower despite still-tight inventories.
At the start of 2020 (week beginning January 6, 2020), oil prices were approximately: Brent crude: ~$68/barrel; WTI: ~$63/barrel; OPEC basket: ~$65/barrel. Prices had been relatively stable in the $60-70 range throughout late 2019. The U.S.-Iran Qasem Soleimani killing in early January 2020 caused a brief spike above $70 before quickly retreating. Markets were not yet pricing in the COVID-19 pandemic risk, which would destroy demand by 25-30% within months.
After an initial price war between Saudi Arabia and Russia (beginning March 6, 2020), OPEC+ reversed course and agreed to historic production cuts of 9.7 million barrels per day on April 12, 2020 - the largest cut in OPEC history. The agreement was mediated partly by U.S. President Trump. Cuts were effective from May 1, 2020 and were gradually tapered as demand recovered: from 9.7M bbl/day in May 2020, to 7.7M in August 2020, to 5.8M by January 2021. OPEC+ maintained production discipline through 2021-2022, then pivoted to active price defense cuts from late 2022 onward.
The Brent-WTI spread (Brent's premium over WTI) averaged approximately $4-6 per barrel during the 2020-2026 period in normal conditions. The spread reflects logistics and transportation costs, quality differences, and structural market factors. It widened dramatically during April 2020 (Cushing storage crisis took WTI to −$37 while Brent stayed near $25 - a $60+ aberration). In June 2026, the spread has narrowed to roughly $3/barrel (Brent ~$78, WTI ~$75) as the Iran-war risk premium faded.
Oil prices recovered strongly throughout 2021 - one of the most sustained commodity price uptrends in recent history. Brent started 2021 at approximately $51/barrel (January) and climbed steadily to approximately $86/barrel by October 2021 - a 69% increase in 10 months. The recovery was driven by OPEC+ production discipline holding firm, COVID vaccine rollouts restoring travel and economic activity, the U.S. shale industry recovering slowly due to capital discipline, and a European energy crisis in autumn 2021. Brent averaged $71/barrel for the full year 2021, up from $41/barrel in 2020.
The OPEC Reference Basket (ORB) typically trades $1-4 per barrel below Brent. The key reasons are: (1) Quality - while some OPEC crudes (e.g., UAE Murban, Libya Es Sider) are light and sweet, others (e.g., Venezuela Merey, Iran Heavy, Saudi Arab Heavy) are heavier and more sour, which requires more refining and trades at a discount; (2) Weighting - the basket averages all member crudes, so heavier blends pull the average below Brent. The ORB is most useful as an indicator of OPEC member country revenue. In June 2026 the basket sits around $76/barrel.
Forecasts shifted sharply after the 2026 Iran War. The EIA expects Brent to average around $105/barrel in June and July 2026 while the Strait of Hormuz remains partly closed, then ease toward $79/barrel in 2027 as Gulf supply returns. Goldman Sachs cut its Brent forecast to $80 for Q4 2026, expecting Persian Gulf exports to return to pre-war levels by the end of July. The IEA warns of a looming surplus - global supply could rise 8 million barrels per day by 2027 against demand growth of just 2 million. Key risks: the durability of the US-Iran ceasefire, the pace of Gulf production restarts, and U.S. shale output near 13.5M bbl/day.
Russia's invasion caused the 2022 price spike to $130/barrel but has had a more nuanced long-term impact. Western sanctions redirected rather than fully removed Russian oil: China and India became major buyers of discounted Russian crude. By 2023/2024, Russian oil export volumes had largely recovered through these alternative channels. The structural changes included a permanent shift in global oil trade flows, accelerated European energy independence investments, and a modest geopolitical risk premium remaining in Brent pricing. By 2025/2026, the Russia-Ukraine war no longer added significant premium to oil prices - though the 2026 Iran War showed how quickly geopolitics can still dominate the market.
U.S. crude oil production reached approximately 13.5 million barrels per day in 2026 - at or above the pre-pandemic record. During the 2026 Iran War, U.S. crude and product net exports hit a record as buyers sought alternatives to disrupted Gulf supply. This record non-OPEC output is a key reason the IEA expects a surplus once the Strait of Hormuz fully reopens. The U.S. became the world's largest oil producer in 2018 and has held that position through 2026. The shale revolution made U.S. production a "floating supply" that responds to prices within months - limiting OPEC's ability to control prices as it once could.
2025 was relatively calm: Brent mostly traded between $65-82/barrel, averaging ~$76, with record U.S. production and growing Brazil and Guyana output keeping prices range-bound. 2026 was completely different. Brent entered the year near $72, then the 2026 Iran War closed the Strait of Hormuz in March, sending Brent surging to nearly $120 and Dubai crude to a record $166. After a May sell-off (−19%, the worst month since COVID) and a mid-June US-Iran peace deal that reopened the strait, Brent fell to around $78 by June 18, 2026. The 2026-to-date average is roughly $92/barrel - war-elevated - and the IEA now warns of a looming oversupply.
