How Many Babies Are Born in the U.S. Each Year?
The United States recorded approximately 3,591,328 births in 2023 (CDC/NCHS final data) and approximately 3,550,000 births in 2024 (CDC preliminary), with 2025 estimates pointing to approximately 3.48–3.52 million and 2026E projected at approximately 3.42–3.48 million. This continues a downward trend from the post-recession peak of 4,316,233 births in 2007, representing an 18% decline in 18 years. At the current 2024 pace, the U.S. averages approximately 9,726 births per day — around 405 per hour, or 1 birth every 8–9 seconds. The U.S. population context, including how births interact with immigration to drive overall growth, is analyzed in our U.S. demographic and wealth analysis.
- 2023 total births: 3,591,328 (CDC/NCHS final data) · down from 3,661,220 in 2022
- 2024 births (preliminary): ~3,550,000 (CDC preliminary) · birth rate ~10.4/1,000
- 2025 estimate: ~3.48–3.52M · TFR ~1.58
- 2026 estimate: ~3.42–3.48M · birth rate ~10.0/1,000 · TFR ~1.56 (BusinessStats Research projection based on CDC trend)
- Birth rate trend: 10.7/1,000 (2023) → 10.4/1,000 (2024E) → 10.2/1,000 (2025E) → 10.0/1,000 (2026E) — each year a new record low
- Peak births: August and September are the most common birth months (November–December conceptions)
- Weekday effect: Tuesday is the most common birth day; Sunday has the fewest births due to fewer scheduled procedures
- California leads by volume: ~420,000–440,000 births annually; followed by Texas (~400,000)
- Hospital births: 98.5% of all U.S. births occur in hospitals; home births ~1.2%; birthing centers ~0.3%
The long-term trajectory of the U.S. birth rate is unmistakably downward. From a baby boom peak of 25.3 births per 1,000 in 1957, the rate has declined almost every decade since. The sharpest single-era drop came in the 1960s and early 1970s, when the oral contraceptive pill became widely available and women entered the workforce in large numbers. A modest stabilization occurred in the 1980s–1990s before the post-2007 recession decline accelerated the downward trend to today's record low of 10.7. The economic factors driving birth rate decisions — wages, housing costs, student debt — are covered in our U.S. financial markets analysis.
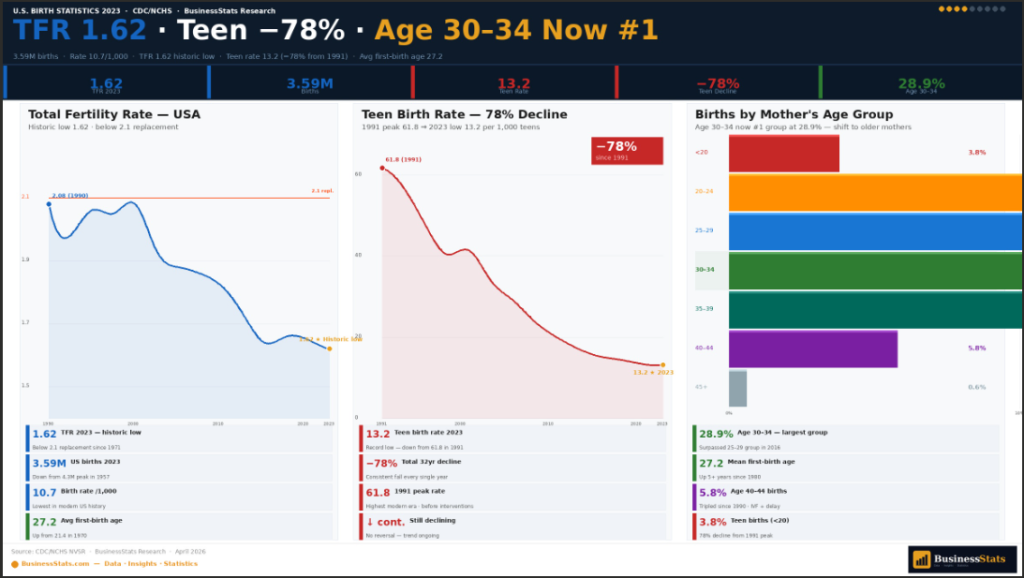
U.S. Total Fertility Rate (TFR) — 1.56 in 2026E, Historic Low
The U.S. total fertility rate (TFR) is estimated at 1.56 children per woman in 2026, the lowest ever recorded in U.S. history — falling well short of the replacement rate of 2.1 needed to maintain population stability without immigration. The TFR has been below replacement continuously since 1972. The last time the U.S. was at or above replacement was 2007 (TFR: 2.12). Each year since, the TFR has set a new low (with a minor 2021 uptick from COVID rebound). The 2026 estimate of 1.56 continues the decline. At current rates, without immigration, each new generation of Americans is approximately 23% smaller than the previous one. This demographic shift has profound implications for Social Security, Medicare, and economic growth — topics analyzed in our global GDP trends report.
- 1957 baby boom peak TFR: 3.77 — nearly every woman had 4 children on average
- 1972 crossover: TFR first fell below replacement (2.1) as birth control became widespread
- 2007 high (modern era): 2.12 — last time U.S. was at replacement level
- 2020 COVID effect: TFR fell to 1.64 as pandemic delayed births
- 2021 rebound: Minor uptick to 1.66 — the "COVID baby bump"
- 2023: TFR 1.62 · 2024: ~1.60 · 2025E: ~1.58 · 2026E: ~1.56 — each year a new historic low
Raising a child in the United States from birth to age 17 costs approximately $300,000 (USDA estimate, 2023 dollars) — before any college expenses. Add average student loan debt of $37,717 per borrower, median home prices exceeding $400,000, and annual childcare costs of $25,000–$35,000 in major metro areas, and the economic math of having children has become significantly harder for younger generations. Surveys consistently show that Americans want more children than they are having — the "ideal" family size is typically cited as 2–3 children, while the actual TFR is 1.62. The gap between desired and actual fertility is driven primarily by economic constraints and delayed life milestones, not a fundamental change in the desire for parenthood. This connects to broader wealth and inequality trends tracked in our U.S. wealth statistics.
U.S. Births by Age of Mother — Older Mothers, Fewer Teen Births
The age composition of U.S. births has shifted dramatically over the past 50 years. The average age of first-time mothers rose from 21.4 years in 1970 to 27.2 years in 2023 — an increase of nearly 6 years in five decades. Meanwhile, teen birth rates have collapsed: from 61.8 per 1,000 in 1991 to approximately 13.2 per 1,000 in 2023 — a 78% decline. Births to women aged 35+ have more than doubled as a share of all births since 2000. This demographic shift toward later childbearing is consistent with trends seen across all high-income countries and is reflected in the content younger demographics consume — tracked in our Instagram statistics, YouTube analysis, and social media report.
- Under 20 (teen births): ~169,000 births (4.7%) · rate 13.2/1K females · down 78% since 1991
- 20–24 years: ~573,000 births (16.0%) · declining fastest among all age groups
- 25–29 years: ~922,000 births (25.7%) · largest single age group · "peak fertility" demographic
- 30–34 years: ~1,039,000 births (28.9%) · surpassed 25–29 as #1 group for first time in 2016
- 35–39 years: ~606,000 births (16.9%) · growing consistently since 2000
- 40–44 years: ~123,000 births (3.4%) · growing fastest in percentage terms (+120% since 1990)
- 45+ years: ~9,000 births (0.3%) · mostly via assisted reproductive technology (ART/IVF)
U.S. Births by State — Total Births and Birth Rate Ranked
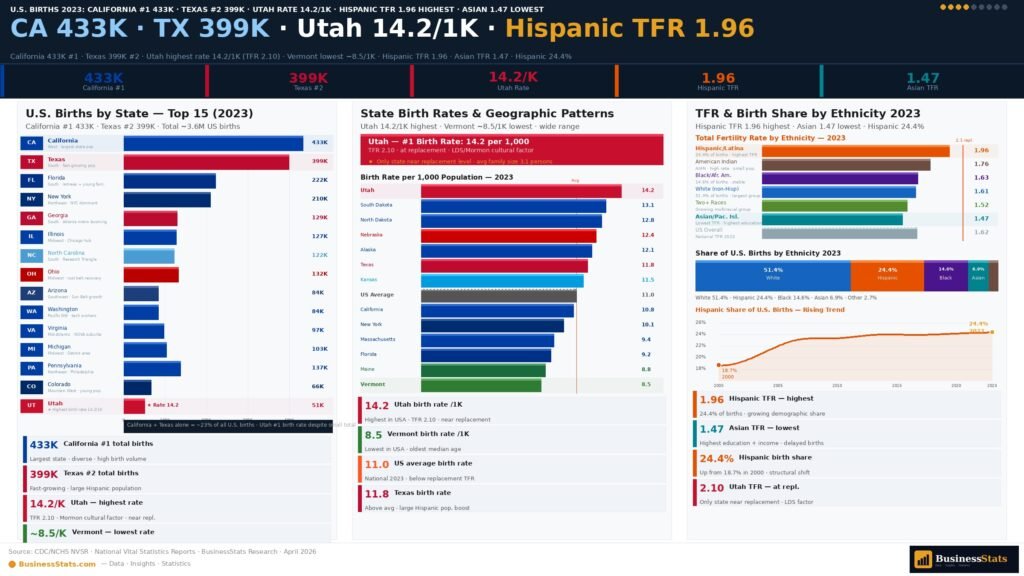
Birth data varies dramatically by state — reflecting differences in population size, age structure, immigration patterns, and religious and cultural composition. California and Texas together account for approximately 24% of all U.S. births purely due to their massive populations. But by birth rate (births per 1,000 population), the rankings are very different: Utah and South Dakota consistently top the rate rankings, while Vermont, Maine, and New Hampshire have the lowest birth rates of any U.S. states. The state-level demographic divergence has major implications for economic growth and political representation — and for retail and consumer companies like Amazon whose baby product sales are heavily concentrated in high-birth-rate states, tracked in our Amazon statistics and economic analysis.
| Rank | State | Total Births | Birth Rate /1K | TFR Est. | Change vs 2022 |
|---|---|---|---|---|---|
| 1 | California | ~433,000 | 11.0 | 1.61 | −1.2% |
| 2 | Texas | ~399,000 | 13.3 | 1.85 | −0.8% |
| 3 | Florida | ~228,000 | 10.5 | 1.60 | −0.5% |
| 4 | New York | ~211,000 | 10.9 | 1.47 | −1.5% |
| 5 | Georgia | ~141,000 | 13.0 | 1.82 | +0.3% |
| 6 | Illinois | ~131,000 | 10.3 | 1.62 | −1.1% |
| 7 | Ohio | ~133,000 | 11.4 | 1.68 | −0.7% |
| 8 | Pennsylvania | ~134,000 | 10.5 | 1.63 | −0.9% |
| 9 | North Carolina | ~118,000 | 11.1 | 1.70 | +0.4% |
| 10 | Arizona | ~87,000 | 11.8 | 1.72 | −0.6% |
| 11 | Virginia | ~90,000 | 10.5 | 1.58 | −1.0% |
| 12 | Michigan | ~96,000 | 9.6 | 1.62 | −1.3% |
| 13 | Washington | ~85,000 | 11.0 | 1.64 | −0.8% |
| 14 | Utah | ~47,000 | 14.2 | 2.10 | −1.5% |
| 15 | Colorado | ~63,000 | 10.8 | 1.65 | −0.7% |
| 16 | Tennessee | ~82,000 | 11.9 | 1.77 | +0.2% |
| 17 | Minnesota | ~65,000 | 11.5 | 1.73 | −0.5% |
| 18 | South Carolina | ~60,000 | 11.4 | 1.72 | +0.1% |
| 19 | Indiana | ~81,000 | 12.0 | 1.81 | −0.4% |
| 20 | Missouri | ~72,000 | 11.8 | 1.74 | −0.6% |
- Highest birth rate: Utah (14.2/1K, TFR ~2.10) — only state near replacement level · strong LDS religious community influence
- Highest birth rate (runner-up): South Dakota (13.8), North Dakota (13.5), Nebraska (13.2)
- Lowest birth rate: Vermont (~8.5/1K), Maine (~9.0), Rhode Island (~9.1), Connecticut (~9.2)
- Most births total: California + Texas together = ~832,000 births, or 23% of U.S. total
U.S. Birth Rate by Race and Ethnicity
Birth rates and fertility differ significantly across racial and ethnic groups in the United States — reflecting differences in age structure, cultural norms, socioeconomic factors, and immigration composition. Hispanic or Latino women have the highest fertility rate (TFR ~1.96) and account for approximately 24% of all U.S. births despite representing approximately 19% of the female population. Non-Hispanic White women have the lowest TFR among major groups (~1.54), reflecting older average age and lower birth rates in each age bracket. These trends connect directly to the long-term shift in U.S. racial and ethnic composition documented in our social media demographics analysis.
- Hispanic/Latina TFR: ~1.96 — highest of all major groups · significant immigrant population effect
- American Indian/Alaska Native TFR: ~1.70 — second highest
- Black/African American TFR: ~1.64 — near national average
- White (non-Hispanic) TFR: ~1.54 — below national average
- Asian TFR: ~1.47 — lowest of all major groups · highly educated, urban concentration
- Hispanic share of births: ~24.4% in 2023, up from 14% in 1990
- Preterm birth disparities: Black infants: 14.4% preterm rate vs White infants: 9.4%
C-Section Rate, Preterm Births & Birth Outcomes
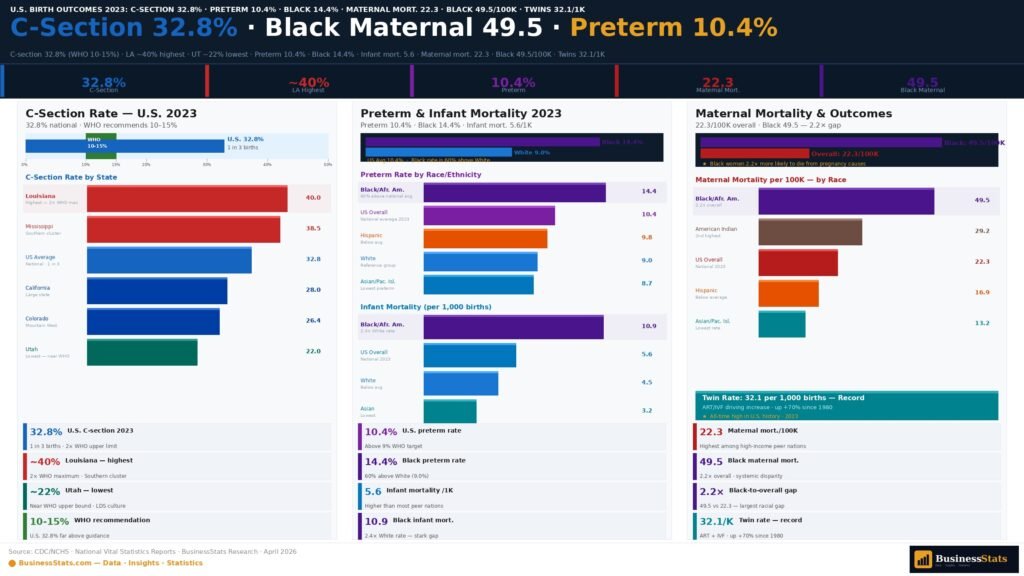
Medical data on U.S. births reveals both progress and persistent challenges. The C-section rate of 32.8% means nearly 1 in 3 American babies is born by cesarean — far above the World Health Organization's recommended rate of 10–15% and significantly higher than peer nations such as the UK (26%), Canada (27%), or the Netherlands (17%). The preterm birth rate of 10.4% means approximately 1 in 10 U.S. babies is born before 37 weeks — a rate higher than most comparable wealthy nations and with significant racial disparities. The infant mortality rate of 5.6 per 1,000 remains higher than most peer countries. The U.S. healthcare system that delivers these births is one of the world's most expensive — covered in our U.S. financial markets analysis. The major healthcare companies that manufacture birth-related medical devices and pharmaceuticals — including Johnson & Johnson, Abbott, and Becton Dickinson — are ranked in our global company valuations report.
- National C-section rate 2023: 32.8% — 1 in 3 births · up from 5% in 1970 · peaked at 32.9% in 2009
- Highest C-section states: Louisiana (~40%), Mississippi (~38%), Alabama (~36%), New Jersey (~35%)
- Lowest C-section states: Utah (~22%), Alaska (~23%), New Mexico (~24%)
- Preterm birth rate 2023: 10.4% (before 37 weeks) — 1 in 10 babies born preterm
- Preterm by race: Black infants 14.4% · AIAN 11.6% · Hispanic 9.7% · White 9.4% · Asian 8.2%
- Infant mortality rate: ~5.6 per 1,000 live births — higher than UK (3.7), Germany (3.2), Japan (1.8)
- Twin birth rate 2023: ~32.1 per 1,000 births — elevated vs historical average due to older mothers and ART
- Low birth weight (<2,500g): ~8.5% of births — higher among Black infants (14.5%) vs White (6.8%)
The U.S. maternal mortality rate is approximately 22.3 per 100,000 live births (2022, CDC) — nearly 3× higher than comparable wealthy nations such as the UK (8.8), Canada (8.4), Germany (4.6), and Australia (3.3). The U.S. rate is also characterized by dramatic racial disparities: Black women face a maternal mortality rate of approximately 49.5 per 100,000 — more than 2.5× the rate for White women (19.0). This maternal mortality crisis is one of the most significant public health challenges in contemporary U.S. healthcare and has become a major focus of obstetric research, policy advocacy, and hospital quality improvement programs. The concentration of healthcare wealth and its distribution connects to the U.S. wealth inequality analysis.
U.S. Birth Statistics — Key Numbers at a Glance
Frequently Asked Questions — U.S. Birth Statistics
The United States recorded approximately 3,591,328 births in 2023 (CDC/NCHS provisional data). This is a slight decline from 3,661,220 in 2022 and continues the long-term downward trend from the peak of 4,316,233 in 2007. Preliminary 2024 data suggests approximately 3.50–3.55 million births. The U.S. averages approximately 9,726 births per day (2024 pace), projected to approximately 9,590 by 2026E. August and September are the most common birth months. Tuesday is the most common day to be born.
The U.S. crude birth rate in 2023 was approximately 10.7 births per 1,000 population, the lowest since modern tracking began. It has declined from 23.7 in 1960 to 14.6 in 2000 to 11.8 in 2010 to 10.7 in 2023. Preliminary 2024 data suggests approximately 10.4–10.6 births per 1,000. The decline reflects falling fertility rates, later average age at first birth, higher childlessness rates, and economic factors including housing costs, student debt, and childcare expenses.
The U.S. total fertility rate (TFR) was approximately 1.62 children per woman in 2023 — the lowest in U.S. history, well below the replacement level of 2.1. The TFR peaked at 3.77 during the 1957 baby boom. It dropped below replacement in 1972 and has been trending downward since 2007 (when it was 2.12, the last time it was at replacement level). The 2023 figure is a historic low. Without immigration, the U.S. population would begin declining within a generation.
California has the most total births of any U.S. state with approximately 420,000–440,000 births annually, followed by Texas (~400,000), Florida (~228,000), New York (~211,000), and Georgia (~141,000). By birth rate (births per 1,000 population), Utah leads at 14.2/1,000 with a TFR near replacement (2.10), followed by South Dakota (13.8), North Dakota (13.5), and Nebraska (13.2). Vermont and Maine typically have the lowest state birth rates (~8.5–9.0/1,000).
The U.S. teen birth rate (ages 15–19) was approximately 13.2 births per 1,000 females in 2023, a 78% decline from the 1991 peak of 61.8. This is one of the largest sustained declines of any public health metric in modern U.S. history. The decline is driven by increased use of long-acting reversible contraceptives (LARCs), delayed sexual initiation, and public health education. Teen births now account for approximately 4.7% of all U.S. births, down from 13% in 1991. Despite this progress, the U.S. teen birth rate remains higher than most Western European peer nations.
The cesarean section (C-section) rate in the United States was approximately 32.8% in 2023, meaning nearly 1 in 3 U.S. births is by C-section. This rate rose from approximately 5% in 1970 to 21% in 1996. The WHO recommends a rate of 10–15%. State variation is significant: Louisiana (~40%) and Mississippi (~38%) have the highest rates, while Utah (~22%) and Alaska (~23%) have the lowest. The high U.S. rate reflects a combination of maternal age factors, liability concerns, hospital incentive structures, and patient preferences.
With approximately 3.55 million births (2024 preliminary), the United States averages approximately 9,726 births per day, or about 405 births per hour, or roughly 1 birth every 8–9 seconds. The most common day to be born is Tuesday, followed by Monday and Wednesday. The fewest births occur on Sundays and federal holidays — a reflection of fewer scheduled C-sections and induced labors on those days. August and September are the most common birth months in the U.S., corresponding to November–December conceptions.
U.S. Total Fertility Rate (TFR) by race/ethnicity (2023): Hispanic/Latina: ~1.96 (highest); American Indian/Alaska Native: ~1.70; Black/African American: ~1.64; White (non-Hispanic): ~1.54; Asian: ~1.47 (lowest). Hispanic women account for approximately 24.4% of all U.S. births despite representing ~19% of the female population. All racial/ethnic groups are below the replacement rate of 2.1. Convergence is occurring as immigrant group fertility rates decline toward the national average across generations.
The average age of first-time mothers in the United States was 27.2 years in 2023, up from 21.4 years in 1970 — an increase of nearly 6 years in five decades. Women are delaying childbearing for education, career, financial stability, and relationship development. Women aged 30–34 are now the largest birth age group (28.9% of all births) — surpassing the 25–29 age group for the first time in 2016. Births to women aged 40+ have grown 120% since 1990, largely due to assisted reproductive technology (ART/IVF).
Approximately 40.5% of all U.S. births in 2023 occurred to unmarried mothers — up dramatically from 5% in 1960 and 18% in 1980. The non-marital birth rate varies significantly by race: approximately 70% of Black births, 52% of Hispanic births, 30% of White (non-Hispanic) births, and 12% of Asian births occur outside of marriage. The rise reflects declining marriage rates, changing social norms, and the economic independence of women. Many non-marital births occur to cohabiting couples in stable relationships.
The U.S. preterm birth rate (births before 37 weeks gestation) was approximately 10.4% in 2023, meaning roughly 1 in 10 U.S. babies is born preterm. Preterm birth rates vary significantly by race: Black infants: 14.4% (highest), American Indian/Alaska Native: 11.6%, Hispanic: 9.7%, White: 9.4%, Asian: 8.2% (lowest). The March of Dimes gives the U.S. a 'D' grade for its preterm birth rate, which is higher than most comparable high-income countries. Preterm birth is the leading cause of infant mortality in the U.S.
U.S. birth trends since the baby boom: Baby boom peak (1957): 4.3 million births, TFR 3.77. 1970s decline: TFR fell below replacement (2.1) in 1972 as birth control became widely available and women entered the workforce. 1980s–2000s: Relative stability around 3.5–4.0M births. Echo boom (late 1980s–early 1990s): Slight uptick as baby boomers had children. Post–Great Recession decline (2008–present): Births fell from 4.32M (2007) to 3.59M (2023), a 17% decline in 16 years. The TFR has fallen nearly every year since 2007, reaching a historic low of 1.62 in 2023.
The U.S. infant mortality rate was approximately 5.6 deaths per 1,000 live births in 2022/23 — higher than most comparable wealthy nations (UK: 3.7, Canada: 4.3, Germany: 3.2, Japan: 1.8). The rate varies significantly by race: Black infants: ~10.9 deaths per 1,000 (nearly 2× the national average); Asian infants: ~3.2 (lowest). The main causes of U.S. infant mortality: birth defects (21%), preterm birth complications (16%), SIDS (7%), accidents (6%). The U.S. infant mortality rate has declined dramatically from 26.0 in 1960 but remains an outlier among peer nations.
The U.S. TFR of 1.62 (2023) is below replacement (2.1) but higher than most Western and East Asian peers. Comparisons: South Korea (0.72, world's lowest), Japan (1.20), Italy (1.24), Spain (1.12), Germany (1.46), UK (1.49), Australia (1.58), Canada (1.40), France (1.68). The U.S. rate is higher than most comparable economies, partly due to higher Hispanic fertility rates (TFR ~1.96) which elevate the national average. The U.S. also has significantly higher immigration which helps sustain population growth despite below-replacement fertility.
Preliminary data for 2024 suggests U.S. births continued their gradual decline to approximately 3.50–3.55 million. The trend reflects persistent economic headwinds (high housing costs, childcare costs of $25,000–$35,000/year in major metros, student debt), cultural shifts toward delayed or foregone childbearing, and demographic aging of prime childbearing-age population (millennials). The 2021 "COVID baby bump" (+1% vs 2020) was short-lived. The Congressional Budget Office projects U.S. births to remain in the 3.4–3.7 million range through 2030, depending primarily on immigration levels and economic conditions.
