Global Travel & Tourism — $11.1 Trillion in 2026
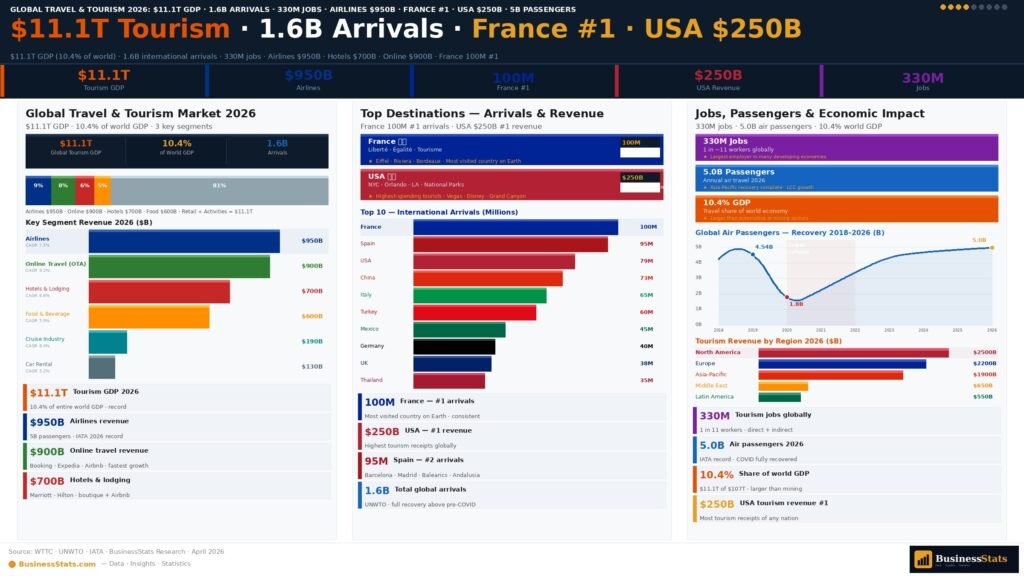
The global travel and tourism industry has fully recovered from COVID-19 — and broken records. With approximately $11.1 trillion in total GDP contribution (direct + indirect + induced), tourism represents 10.4% of the world economy — more than the automotive and chemicals industries combined. International arrivals crossed 1.6 billion in 2025, surpassing the pre-COVID 2019 record of 1.5 billion. The industry's 330 million jobs make it the world's largest service sector employer. The economic context enabling global tourism is analyzed in our global GDP analysis.
- GDP contribution: $11.1T total (direct + indirect + induced) · 10.4% of global GDP · highest ever
- International arrivals: ~1.6B (2025) · surpassed 2019 record (1.5B) · +10% vs 2024
- Employment: 330M jobs worldwide · 1 in 10 workers globally · above pre-COVID (320M in 2019)
- Tourism receipts: ~$1.9T in international tourism receipts (2025) · above 2019's $1.7T
- COVID recovery: Arrivals fell 84% in 2020 (247M) · full recovery complete by 2025
- Fastest growing: Middle East +22% arrivals · Asia-Pacific full rebound from delayed reopening
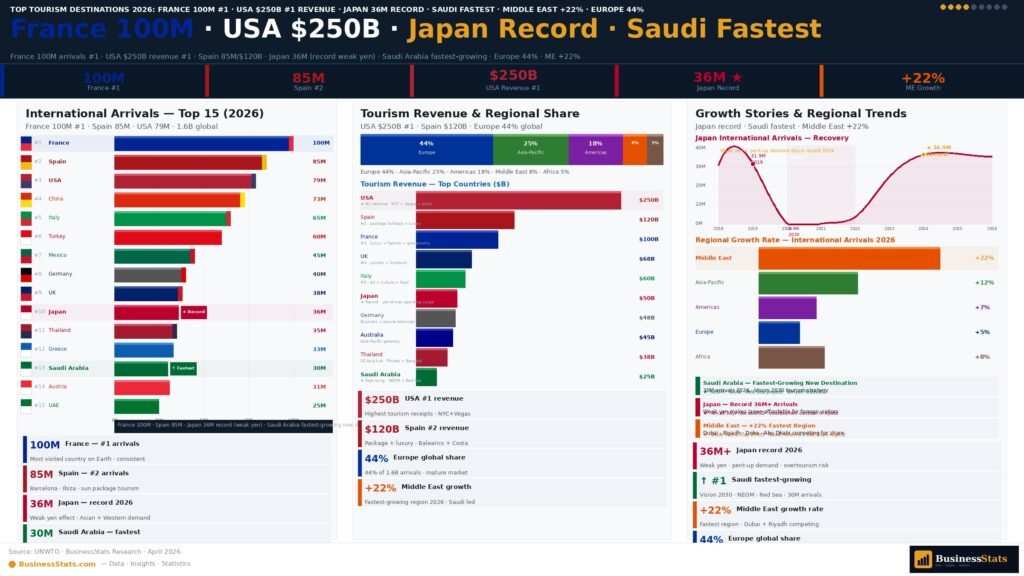
The recovery was uneven. Europe recovered first, reaching pre-COVID levels in 2023. Asia-Pacific lagged due to China's late border reopening (January 2023) but surged since — Japan alone received a record 36 million visitors in 2025 driven by a weak yen. The Middle East is the decade's biggest structural growth story: Saudi Arabia's Vision 2030 has transformed the Kingdom into a major tourism destination, while Dubai continues to break records. The global travel industry connects to retail spending patterns tracked in our global e-commerce analysis.
- Europe: 710M arrivals (44% of global) · France, Spain, Italy leading · record tourism receipts
- Asia-Pacific: 390M arrivals · Japan 36M (record) · Thailand 35M · South Korea 20M
- Middle East: 100M arrivals · fastest growth (+22%) · Saudi Arabia + UAE structural expansion
- Americas: 220M arrivals · USA dominant · Caribbean and Mexico benefiting from North American surge
International Tourist Arrivals — COVID Crash & Full Recovery
The COVID-19 pandemic produced the most catastrophic single-year collapse in tourism history — a 84% decline from 1.5 billion (2019) to just 247 million (2020). The recovery has been equally dramatic. By 2025 international arrivals reached approximately 1.6 billion — a new record. The airline industry and global financial markets during this period are analyzed in our financial markets analysis.
- 2019: 1.50B — pre-COVID record
- 2020: 0.25B — −84% · COVID-19 border closures
- 2021: 0.42B — +72% · vaccinations beginning
- 2022: 0.96B — +127% · Europe & Americas leading
- 2023: 1.29B — +34% · Asia-Pacific reopening
- 2024: 1.45B — +12% · near-complete global recovery
- 2025: 1.60B — +10% · new record · Middle East & Japan outperforming
Top Tourist Destinations — Most Visited Countries & Highest Revenue
France has held the title of world's most visited country since the 1990s — approximately 100 million international tourists annually. Yet France ranks only 4th by revenue (~$80B), behind USA ($250B), Spain ($120B), and UK ($85B). This gap reflects France's high proportion of day-trippers from neighboring countries who spend relatively little. Spain is arguably the world's most successful tourism economy — 85 million visitors generating $120 billion in receipts while employing 13% of the workforce. The economic power of these destinations connects to our global GDP rankings.
Top Countries by Tourism Revenue 2025 (USD Billion)
Japan welcomed approximately 36 million international visitors in 2025 — a new national record, surpassing its previous high of 31.9 million (2019). The yen hit a 34-year low against the U.S. dollar, making Japan one of the world's most affordable luxury destinations. The surge created genuine over-tourism pressure in Kyoto, Osaka, and Tokyo — with visitor caps and crowd-control measures introduced. Japan's experience illustrates the double-edged nature of currency-driven tourism booms. The global brand economy connecting Japan's tourism appeal to product exports is tracked in our global market analysis.
Airline Industry, Hotel Sector & Online Travel Agencies 2026
The global airline industry generated approximately $950 billion in revenue in 2025, with net profit of approximately $36 billion — the strongest year in post-COVID history. IATA reported approximately 5.0 billion passengers — exceeding the 2019 record of 4.5 billion. Low-cost carriers now hold approximately 35% of global capacity, up from 25% in 2015. Boeing's production delays have constrained fleet expansion, paradoxically boosting revenue per passenger. The aviation industry's supply chain dynamics are analyzed in our global company valuations.
- Global airline revenue 2025: ~$950B · net profit $36B · strongest profitability since pre-2008
- Air passengers 2025: 5.0B · above 2019 record (4.5B) · Asia-Pacific routes growing fastest
- U.S. Big 3 (AA/Delta/United): Combined ~$150B revenue · world's most profitable carriers
- Low-cost carriers: 35% of global capacity · Ryanair (Europe #1) · IndiGo (India #1)
- Boeing crisis: 737 MAX production backlog constraining fleet · pushing average fares +12–18%
- SAF: Sustainable Aviation Fuel at ~1% of total fuel use · IATA target of 2% by 2025 missed
The global hotel industry recovered to approximately $700 billion in revenue in 2025. Average Daily Rate (ADR) reached approximately $145/night globally — significantly above 2019's $120. Marriott International leads with approximately 9,000 properties and 1.65 million rooms, followed by Jin Jiang, Hilton, Wyndham, and IHG. The hospitality industry's social media marketing power is tracked in our social media statistics and Instagram analysis.
- Global hotel revenue 2025: ~$700B · ADR $145/night · RevPAR $96 · Occupancy 66%
- Marriott International: ~9,000 properties · 1.65M rooms · 30 brands · $25B revenue
- Luxury segment: ADR $400+ · Aman, Four Seasons, Rosewood growing 15%+ p.a.
- Airbnb + Vrbo: ~20% of total accommodation market by value
Online Travel Platforms — Revenue Rankings 2025
Digital Travel Trends — AI Planning, Social Commerce & Wellness
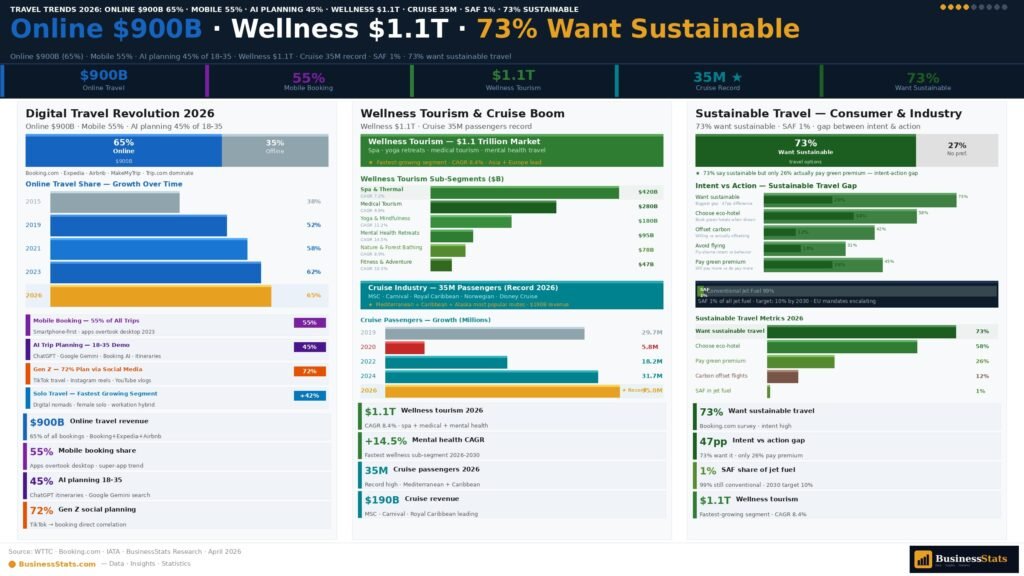
Artificial intelligence is reshaping how travelers discover and book trips. In 2025, AI chatbots (ChatGPT, Gemini) overtook Google search as the primary first-touch for travel inspiration among the 18–35 demographic. 73% of global travelers want to travel sustainably — though only 42% take concrete steps. The platform dynamics behind digital travel discovery are tracked in our Amazon statistics, YouTube analysis, and Instagram report.
- AI travel planning: 45% of travelers aged 18–35 used AI chatbots for trip planning in 2025 (up from 12% in 2023)
- TikTok travel: #travel 450B+ views · "TikTok made me do it" driving bookings to niche destinations
- Mobile bookings: 55% of all online travel transactions · up from 40% in 2020
- Same-day bookings: 28% of hotel bookings made same day as arrival · driven by mobile apps
- "Set-jetting": TV/film-inspired travel · White Lotus Thailand effect: +34% luxury bookings
- Bleisure travel: Business + leisure · 40% of business travelers extending trips · $1.8T blended market
- Sustainability: 73% want eco-travel · only 42% act · carbon offset bookings +180% since 2020
- Wellness tourism: $1.1T market · growing 9.9% p.a. · Europe $365B · North America $325B
- Medical tourism: $100B+ · Thailand, India, Turkey, Mexico leading destinations
- Cruise boom: 35M passengers 2025 (record) · $60B revenue · Asia-Pacific fastest growing
- Space tourism: Virgin Galactic, SpaceX, Blue Origin · commercial suborbital now available
Travel & Tourism Worldwide — Key Statistics & Facts 2026
Global Travel & Tourism — Forecast & Outlook 2026–2030
The WTTC projects global tourism to contribute approximately $16 trillion to global GDP by 2034. By 2030, international arrivals are projected to reach approximately 2.0 billion annually. China's outbound tourism alone is projected to generate 200 million trips annually by 2030. The global economic growth context is analyzed in our global GDP report. Consumer wealth driving premium travel is tracked in our wealth statistics.
- 2030 arrivals: ~2.0B international tourists projected — +25% vs 2025
- 2034 GDP: WTTC projects $16T total tourism GDP — +44% vs 2025
- Asia dominance: Asia-Pacific projected to overtake Europe by arrivals by 2033–2035
- China outbound: 200M Chinese tourists by 2030 — world's largest outbound market
- India growth: 50M+ outbound trips from India by 2028 — 20%+ annual growth
- Saudi Vision 2030: Targeting 150M annual visitors by 2030 (from ~100M in 2025)
Frequently Asked Questions — Travel & Tourism 2026
The global travel and tourism industry contributed approximately $11.1 trillion to global GDP in 2025/26 — representing 10.4% of world GDP, the highest share ever recorded. The industry employs approximately 330 million people globally — about 1 in 10 of all jobs worldwide. International tourist arrivals reached approximately 1.6 billion in 2025, surpassing the pre-COVID record of 1.5 billion (2019) for the first time. Total international tourism receipts reached approximately $1.9 trillion in 2025.
France remains the world's most visited country, receiving approximately 100 million international visitors annually. Top 5: France (~100M), Spain (~85M), USA (~80M), China (~76M), Italy (~70M). By tourism revenue: USA (#1, ~$250B), Spain (#2, ~$120B), UK (#3, ~$85B), France (#4, ~$80B), UAE (#5, ~$70B). The USA leads revenue because visitors spend significantly more per trip — averaging $3,000+ vs much lower for day-trippers to France.
Global tourism has fully recovered from COVID-19. Arrivals collapsed from 1.5 billion (2019) to just 247 million (2020) — an 84% decline. Recovery: 424M (2021), 963M (2022), 1.29B (2023), 1.45B (2024), approximately 1.6 billion in 2025 — a new record. Europe recovered first (2023). Asia-Pacific lagged due to China's late border reopening but has since surged. International tourism revenues exceeded pre-pandemic levels in 2024. Hotel ADR (room rates) remain 21% above 2019 in dollar terms.
The global online travel market reached approximately $900 billion in 2025 — 65% of all travel bookings. Major platforms: Booking Holdings ~$22B; Expedia Group ~$13B; Airbnb ~$10.9B; Trip.com ~$8B. Mobile bookings: 55% of all online transactions. AI-powered trip planning is the most significant emerging disruption — ChatGPT/Gemini overtaking Google as first-touch for travel inspiration among younger travelers in 2025.
The global travel and tourism industry employs approximately 330 million people in 2026 — 1 in 10 jobs worldwide. This includes direct tourism employment (hotels, airlines, attractions, restaurants) and indirect employment (supply chains, construction). Tourism was devastated by COVID-19, losing approximately 62 million jobs in 2020, but recovered to above pre-pandemic levels (320 million in 2019) by 2024. For many island nations and least-developed countries, tourism accounts for 20–50% of total employment.
Airbnb generated approximately $10.9 billion in revenue in 2025. The platform has over 7.7 million active listings in 220+ countries and 100,000+ cities. Approximately 500 million cumulative guest arrivals since founding in 2008. Airbnb holds approximately 20% of the global short-term rental market by value. Particularly dominant in leisure, family, and group travel. Airbnb takes approximately 3% from hosts and 12–16% from guests as service fees.
The global airline industry generated approximately $950 billion in revenue in 2025, with net profit of approximately $36 billion — the strongest year since pre-COVID. Approximately 5.0 billion passengers flew — above the 2019 record of 4.5 billion. Low-cost carriers hold approximately 35% of global capacity. Boeing production delays constrained fleet growth (pushing fares 12–18% above 2019). IATA projects the industry to reach $1.1 trillion by 2028 and carry 8.0 billion passengers by 2043.
The global hotel industry generated approximately $700 billion in revenue in 2025, above pre-pandemic levels. Global hotel occupancy averaged 66% (vs 68% in 2019). ADR (Average Daily Rate): approximately $145/night globally — 21% above 2019. RevPAR: approximately $96. Marriott International leads with ~9,000 properties and 1.65 million rooms, followed by Jin Jiang (~12,000 properties), Hilton (~8,000), Wyndham (~9,200), and IHG (~6,300).
Europe leads global tourism with approximately $900 billion in tourism receipts and 710 million arrivals (44% of global total) in 2025. The Asia-Pacific region is fastest-growing at 8.2% annually — projected to overtake Europe by arrivals by 2033–2035. The Middle East leads in percentage growth at +22%, driven by Saudi Arabia's Vision 2030 and Dubai's continued expansion. North America generated approximately $350 billion in tourism receipts.
Top 2026 travel trends: (1) AI trip planning — 45% of 18-35 travelers use AI chatbots for planning; (2) "Set-jetting" — visiting locations from popular TV shows (White Lotus Thailand: +34% bookings); (3) Wellness tourism — $1.1T market growing 9.9% p.a.; (4) Sustainable travel — 73% want it, 42% act; (5) Bleisure — 40% of business travelers extending trips; (6) Mobile-first — 55% of online bookings via mobile; (7) Same-day bookings — 28% of hotel bookings made day-of-arrival.
The global wellness tourism market reached approximately $1.1 trillion in 2025, growing at 9.9% annually — nearly twice the rate of overall tourism growth. Europe leads ($365B), followed by North America ($325B) and Asia-Pacific ($230B). Wellness tourism includes spa retreats, medical tourism ($100B+), yoga/meditation travel, forest bathing, longevity programs, and health-focused travel. Thailand, India, and Bali are top wellness destinations. Post-COVID mental health awareness has been the primary growth driver.
The global cruise industry carried approximately 35 million passengers in 2025 — a new record, surpassing the pre-COVID high of 30 million (2019). Cruise industry revenue reached approximately $60 billion. Carnival Corporation holds approximately 50% market share. Royal Caribbean is #2 with approximately 30%. Asia-Pacific cruise is the decade's fastest-growing sub-market. Average cruise passenger spends $1,800+. River cruising growing 15% annually, expedition/adventure cruising 25% annually.
Domestic tourism accounts for approximately 75–80% of total tourism spending globally — approximately $4.3 trillion in 2025/26. The USA has the world's largest domestic tourism market at approximately $1.1 trillion annually. China's domestic market is approximately $750 billion. India's domestic tourism is growing at 15%+ annually. During COVID-19, domestic tourism recovered much faster than international tourism and acted as a lifeline for tourism economies worldwide.
The WTTC projects global travel and tourism to contribute approximately $16 trillion to global GDP by 2034. By 2030, international tourist arrivals are projected to reach approximately 2.0 billion annually. The UNWTO projects Asia to become the dominant tourism region. Key growth drivers: rising middle class in India and Southeast Asia; cheaper long-haul air travel; AI-enabled personalized travel planning; and continued growth of experience-economy travel. China outbound tourism is projected at 200 million trips annually by 2030.
France receives approximately 100 million international tourists annually — the world's most visited country. However, France earns only approximately $80 billion in international tourism receipts — ranking 4th globally by revenue. The discrepancy reflects the high proportion of day-trippers from neighboring UK, Germany, and Belgium who visit but spend relatively little. Paris accounts for approximately 35 million overnight stays annually. French tourism contributes approximately 7% of France's GDP. The USA earns $250B from 80M visitors (higher spend per visitor) versus France's $80B from 100M visitors.
