Cost of Living in the U.S. 2026 — A Nation Under Financial Pressure
The cost of living in the United States has undergone a dramatic transformation since 2020, driven by a confluence of forces including pandemic-era supply chain disruptions, unprecedented monetary stimulus, a post-pandemic housing supply shortage, and persistent structural inflation in healthcare and education. The average American household now spends approximately $77,280 per year — or approximately $6,440 per month — on all living expenses. This represents an increase of approximately $14,800 per household compared to 2020, equivalent to an additional $1,233 per month of spending just to maintain the same standard of living. For millions of Americans, particularly renters and lower-income households, wages have not kept pace with this cost acceleration — creating a widening affordability gap that has become one of the defining economic and political issues of the mid-2020s. The cost of living crisis is not uniform: rural areas and Midwest cities remain dramatically more affordable than coastal metros, with a family in Des Moines able to live comfortably on a budget that would leave them in poverty in San Francisco or New York. For U.S. financial market context see our U.S. financial markets statistics.
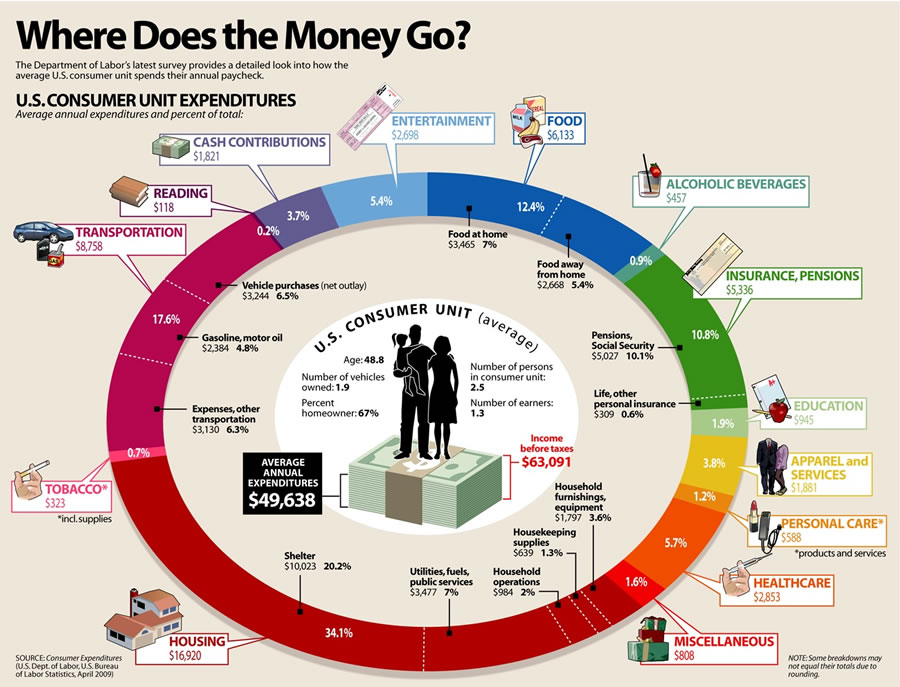
The five largest expense categories for American households in 2026 are housing (33% of expenditure), transportation (16%), food (13%), healthcare (8%), and personal insurance and pensions (12%). These five categories collectively account for approximately 82% of total household spending, leaving only 18% for everything else — entertainment, clothing, education, personal care, and discretionary spending. The compression of discretionary spending as essential costs rise has significant consequences for consumer-facing businesses and the broader retail economy. Understanding these spending patterns is essential context for businesses, investors, policymakers, and individuals making financial and location decisions in the current environment. For the e-commerce retail context see our Alphabet revenue statistics covering how cost pressures are reshaping consumer purchasing behaviour.
U.S. Housing Costs 2026 — The Affordability Crisis Deepens
Housing has become the dominant financial challenge for Americans in 2026. The median U.S. home price reached approximately $420,000 in 2025 — up from approximately $292,000 in 2020, a 44% increase in just five years that has locked millions of potential first-time buyers out of homeownership. This price surge was driven by historically low mortgage rates in 2020-2021 that flooded the market with buyer demand, a severe supply shortage as construction failed to keep pace with household formation, and remote work-driven migration that brought higher-income buyers into previously affordable markets. The subsequent rise in mortgage rates from approximately 3% in 2021 to over 7% in 2023-2025 has created a "lock-in effect" — existing homeowners with low-rate mortgages are reluctant to sell, further restricting inventory and preventing the price correction that higher rates would normally trigger. For financial market context around mortgage rates and housing finance see our Nasdaq stock market statistics.
U.S. Median Home Price 2018–2025 — Five-Year Surge
The trajectory of U.S. median home prices over the 2018-2025 period tells the story of two distinct housing markets: the relatively stable pre-pandemic period from 2018 to early 2020 where prices grew at approximately 5-6% annually, and the post-pandemic acceleration where prices grew at 15-18% annually in 2021 and 2022 before moderating to 4-6% growth in 2023-2025 as higher mortgage rates dampened demand. First-time homebuyers now need a household income of approximately $120,000 to qualify for a median-priced home at current mortgage rates, up from approximately $63,000 in 2020.
U.S. Rental Market — Monthly Rent Trends 2020–2025
The rental market has borne the brunt of the housing affordability crisis, with renters facing dramatic rent increases across most markets. The national median monthly rent for a one-bedroom apartment reached approximately $1,620 in 2025, up from approximately $1,100 in 2020 — a 47% increase. For two-bedroom units, the national median reached approximately $1,940 per month. Approximately 30% of American renters are classified as cost-burdened — spending more than 30% of gross income on rent — and approximately 15% are severely cost-burdened, spending more than 50% of gross income on housing.
U.S. Food Costs 2026 — Grocery Bills Up 25% Since 2020
Food costs represent approximately 13% of average U.S. household expenditure — the third-largest expense category after housing and transportation. The average American household spent approximately $10,046 on food in 2025, split roughly 55% on food at home (groceries) and 45% on food away from home (restaurants, delivery). Grocery prices have increased approximately 25% since 2020, driven by supply chain disruptions during the pandemic, the Russia-Ukraine war's impact on wheat and fertiliser prices, labour cost increases in food processing and retail, and drought conditions affecting major agricultural regions. Eggs experienced the most dramatic price surge — up approximately 130% from 2020 to 2025 — driven by successive avian influenza outbreaks that devastated laying hen flocks.
Average U.S. Grocery Spending by Category 2025
The average American household grocery budget of approximately $5,525 per year is distributed unevenly across food categories, with meat, poultry, and seafood consuming the largest single share at approximately 26% of grocery spending. One significant trend is the dramatic growth in private-label (store brand) purchasing: approximately 43% of grocery items purchased by American households in 2025 are private label, up from approximately 25% in 2019.
U.S. Healthcare Costs 2026 — $6,200 Per Person Annually
Healthcare is America's fastest-growing major cost category and one of the most significant differentiators between the U.S. cost of living and that of comparable wealthy nations. The average American spends approximately $6,200 per person per year on healthcare in 2025 — more than double the per-capita healthcare spending of Germany, France, or the United Kingdom, and approximately 3.5 times the OECD average. Healthcare costs have risen approximately 18% since 2020, moderately below the overall cost of living increase but on top of a baseline that was already the world's most expensive. For financial market context on healthcare sector investment see our U.S. financial markets statistics.
The U.S. healthcare system's cost structure is unique among wealthy nations. While other high-income countries spend $3,000-$4,500 per capita on healthcare and achieve comparable or better health outcomes, the U.S. spends $6,200 per person — driven by administrative overhead (approximately 34% of healthcare spending versus 12-15% in other wealthy countries), higher prices for drugs and procedures, and fee-for-service reimbursement models that incentivise volume over outcomes.
U.S. Healthcare Spending Components — What Americans Actually Pay
The largest single component is health insurance premiums — approximately $8,435 per year for individual coverage and $23,968 for family coverage in 2025, though employer contributions typically cover approximately 70-80% of these premiums. Out-of-pocket spending including deductibles, copayments, and coinsurance averages approximately $1,800 per person annually. Prescription drug costs average approximately $1,300 per year on medications.
U.S. Transportation Costs 2026 — $13,174 Per Household Annually
Transportation is the second-largest household expense category for Americans, consuming approximately 16% of household budgets — approximately $13,174 per year for the average household in 2025. Approximately 91% of American households own at least one vehicle. New vehicle prices reached a record average of approximately $48,800 in 2025, up 32% from 2020. Auto insurance costs have risen particularly sharply — up approximately 38% since 2022. For technology investment context in the automotive sector see our AI market size statistics.
Cost of Living by U.S. City 2026 — New York to Tulsa
The variation in cost of living across U.S. cities is among the most dramatic of any major developed economy. New York City scores approximately 187 — meaning life there costs 87% more than the national average — while Harlingen, Texas scores approximately 78. This 2.4x cost differential between the most and least expensive major markets shapes migration patterns, remote work decisions, and business location choices. For context on how these cost differentials affect purchasing power see our global GDP statistics.
Cost of Living Index — Top 10 Most Expensive U.S. Cities 2026
The most expensive cities are concentrated in two coastal clusters — the Northeast corridor and the California coast — plus Hawaii. The emergence of Austin, Nashville, and Boise as relatively expensive cities reflects remote work migration that has brought coastal incomes into previously affordable markets.
U.S. Household Spending Breakdown 2026 — Where the $77,280 Goes
In 2025, the average household unit spent approximately $77,280, distributed across five major categories that together account for approximately 82% of total spending. Housing remains the dominant expense at approximately 33% — or $25,500 per year. Transportation at 16% ($12,360) reflects America's car-dependent infrastructure. Food at 13% ($10,046) covers both groceries and dining out. For context on how digital commerce is reshaping these spending patterns see our fintech statistics.
U.S. Cost of Living Inflation by Category 2020–2025
Not all cost categories have risen at the same rate since 2020. Housing costs (+44%) have devastated renters and first-time buyers. Energy costs (+32%) have hit lower-income households hardest. The only major category where costs have declined is electronics and technology. For stock market context see our stock market terminology guide.
| Category | 2020 Index | 2025 Index | % Change | Impact Level |
|---|---|---|---|---|
| Housing | 100.0 | 144.0 | +44% | Very High |
| Energy | 100.0 | 132.0 | +32% | High |
| Groceries | 100.0 | 125.0 | +25% | High |
| Auto Insurance | 100.0 | 138.0 | +38% | High |
| New Vehicles | 100.0 | 132.0 | +32% | High |
| Healthcare | 100.0 | 118.0 | +18% | Moderate |
| Dining Out | 100.0 | 128.0 | +28% | High |
| Education | 100.0 | 114.0 | +14% | Moderate |
| Electronics | 100.0 | 92.0 | -8% | Positive |
| Overall CPI | 100.0 | 124.0 | +24% | High |

U.S. Cost of Living Forecast — Pressures Persist Through 2028
The U.S. cost of living is projected to continue rising through 2028, though at a more moderate pace. Overall consumer prices are forecast to increase approximately 8-12% cumulatively from 2025 to 2028. Housing costs are expected to remain elevated due to structural undersupply estimated at 3-5 million units nationally. Healthcare costs are projected to accelerate with per-capita spending potentially reaching $7,200 by 2028. For economic outlook context see our global GDP statistics.
Frequently Asked Questions — U.S. Cost of Living
The average American household spends approximately $6,440 per month ($77,280 per year) on all expenses including housing, food, transportation, healthcare and other costs. This represents an increase of approximately $1,233 per month compared to 2020.
New York City is the most expensive major city in the United States, with a cost of living index of approximately 187 compared to the national average of 100. San Francisco (180), Honolulu (175), Washington D.C. (159), and Boston (155) round out the top five.
The median U.S. home price reached approximately $420,000 in 2025, up 44% from 2020. The median monthly rent for a one-bedroom apartment is approximately $1,620 nationally, ranging from approximately $850 in affordable Midwest markets to over $3,500 in New York and San Francisco.
Americans spend approximately 33% of after-tax income on housing on average. Approximately 30% of American renters are cost-burdened — spending more than 30% of gross income on housing.
The overall U.S. cost of living increased approximately 24% between 2020 and 2025. Housing costs rose 44%, auto insurance increased 38%, grocery prices rose 25%, dining out increased 28%, energy costs rose 32%, and healthcare increased 18%. Only electronics declined (-8%).
Primary: Bureau of Labor Statistics — Consumer Expenditure Survey 2025
Primary: National Association of Realtors — Housing Statistics 2025
Supporting: Zillow Research · KFF Employer Health Benefits Survey 2025 · C2ER Cost of Living Index Q4 2025 · BLS Consumer Price Index 2025 · U.S. Census Bureau ACS 2025