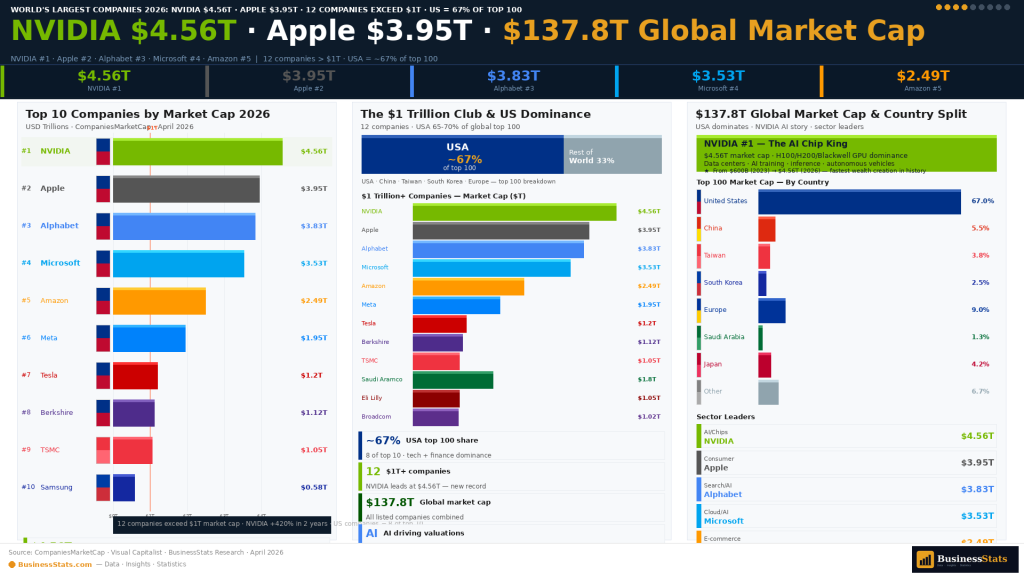
The World's Largest Companies by Market Cap 2026 — AI Has a New Champion
The global equity market has undergone a seismic transformation between 2023 and 2026. What was once a ranking dominated by Apple's consumer hardware and Microsoft's enterprise software has been claimed by NVIDIA — a company that in 2020 was primarily known as a gaming GPU maker. NVIDIA's market cap of approximately $4.56 trillion makes it the fastest riser in stock market history to reach $1T, $2T, $3T, and $4T milestones.
The broader picture is equally striking. Twelve companies worldwide now exceed a $1 trillion market capitalization, a threshold Apple first breached in 2018. The Magnificent Seven (Alphabet, Amazon, Apple, Meta, Microsoft, NVIDIA, and Tesla) collectively hold $597 billion in cash reserves, more than enough to acquire most S&P 500 companies.
- U.S. dominance: American companies account for 65–70 of the top 100 positions, with the top 50 U.S. companies exceeding $30 trillion in combined market cap.
- AI drives value: 8 of the top 10 companies are technology firms — and all are directly exposed to the AI infrastructure buildout, either as chip makers, cloud providers, or AI software platforms.
- Magnificent Seven cash: $597 billion in reserves, yet financing AI infrastructure largely through debt — preserving optionality for future acquisitions.
Outside the United States, Taiwan's TSMC has muscled into the global top six, reflecting the world's growing strategic dependence on advanced semiconductor manufacturing. Saudi Aramco remains one of only two non-U.S. companies consistently holding a top-10 position. China contributes approximately 10–12 names in the top 100 — but regulatory headwinds and U.S.-China trade tensions have suppressed valuations of Alibaba, Tencent, and PetroChina well below their peaks.
World's 10 Most Valuable Companies — Market Cap Rankings 2026
NVIDIA is the largest company in the world with a market cap of approximately $4.56 trillion, followed by Apple at $3.95T, Alphabet at $3.83T, Microsoft at $3.53T, and Amazon at $2.49T. This top-five configuration represents a dramatic shift from 2022, when Microsoft and Apple alternated between first and second. The AI revolution has fundamentally reordered the world's corporate value hierarchy in just 24 months — a pace of value creation without precedent in modern financial history.
Top 10 Companies — Market Capitalization Visualised
The chart below makes the scale of NVIDIA's dominance visually clear. At $4.56 trillion, NVIDIA's market cap is larger than the entire GDP of Germany — and nearly equal to the combined market caps of the next two companies (Apple + Alphabet). This level of single-company dominance is unprecedented in the history of global equity markets.
Notice the massive gap between NVIDIA ($4.56T) and the rest. The next four companies (Apple, Alphabet, Microsoft, Amazon) are each between $2.5T and $4T. Then there is a significant drop to the $1T–$2T range, where TSMC, Saudi Aramco, Meta, Tesla, and Berkshire Hathaway cluster. This two-tier structure reflects the extraordinary premium the market assigns to AI leadership at scale.
| Rank | Company | Ticker | Market Cap | Country | Sector |
|---|---|---|---|---|---|
| 1 | NVIDIA | NVDA | ~$4.56 Trillion | 🇺🇸 USA | Semiconductors / AI |
| 2 | Apple | AAPL | ~$3.95 Trillion | 🇺🇸 USA | Consumer Electronics |
| 3 | Alphabet | GOOGL | ~$3.83 Trillion | 🇺🇸 USA | Technology / AI |
| 4 | Microsoft | MSFT | ~$3.53 Trillion | 🇺🇸 USA | Software / Cloud |
| 5 | Amazon | AMZN | ~$2.49 Trillion | 🇺🇸 USA | E-Commerce / Cloud |
| 6 | TSMC | TSM | ~$1.2–$2 Trillion | 🇹🇼 Taiwan | Semiconductor Mfg |
| 7 | Saudi Aramco | 2222 | ~$1.6 Trillion | 🇸🇦 Saudi Arabia | Oil & Gas |
| 8 | Meta Platforms | META | ~$1.4 Trillion | 🇺🇸 USA | Social Media / AI |
| 9 | Tesla | TSLA | ~$1.1 Trillion | 🇺🇸 USA | EVs / Robotics |
| 10 | Berkshire Hathaway | BRK.B | ~$1.0+ Trillion | 🇺🇸 USA | Diversified / Finance |
Ranks 11–50 — Financial Giants, Pharma, and Global Challengers
Positions 11–50 reveal the full complexity of the global market hierarchy — a zone where financial powerhouses, pharmaceutical giants, and AI-adjacent technology companies compete for rank. In this band, Broadcom just crossed the $1 trillion threshold and Eli Lilly has become the world's most valuable pharmaceutical company thanks to its GLP-1 drug portfolio (Mounjaro, Zepbound).
| Rank | Company | Market Cap | Country | Sector |
|---|---|---|---|---|
| 11 | Broadcom | ~$1.0T | 🇺🇸 USA | Semiconductors / Software |
| 12 | Walmart | ~$780B | 🇺🇸 USA | Retail / Consumer |
| 13 | Eli Lilly | ~$730B | 🇺🇸 USA | Pharmaceuticals / GLP-1 |
| 14 | JPMorgan Chase | ~$700B | 🇺🇸 USA | Banking / Finance |
| 15 | Visa | ~$620B | 🇺🇸 USA | Payments / FinTech |
| 16 | Tencent | ~$590B | 🇨🇳 China | Internet / Gaming |
| 17 | Johnson & Johnson | ~$420B | 🇺🇸 USA | Healthcare / Pharma |
| 18 | UnitedHealth Group | ~$415B | 🇺🇸 USA | Health Insurance |
| 19 | Exxon Mobil | ~$500B | 🇺🇸 USA | Oil & Gas |
| 20 | Mastercard | ~$490B | 🇺🇸 USA | Payments |
| 21 | Samsung Electronics | ~$310B | 🇰🇷 S.Korea | Electronics / Memory |
| 22 | Procter & Gamble | ~$390B | 🇺🇸 USA | Consumer Goods |
| 23 | Oracle | ~$460B | 🇺🇸 USA | Cloud / Enterprise Software |
| 24 | Home Depot | ~$405B | 🇺🇸 USA | Retail / Home Improvement |
| 25 | ASML | ~$285B | 🇳🇱 Netherlands | Semiconductor Equipment |
| 26 | Costco | ~$430B | 🇺🇸 USA | Retail / Wholesale |
| 27 | Bank of America | ~$340B | 🇺🇸 USA | Banking |
| 28 | Novo Nordisk | ~$380B | 🇩🇰 Denmark | Pharmaceuticals / GLP-1 |
| 29 | Hermès | ~$260B | 🇫🇷 France | Luxury Goods |
| 30 | Chevron | ~$280B | 🇺🇸 USA | Oil & Gas |
| 31 | LVMH | ~$310B | 🇫🇷 France | Luxury / Consumer |
| 32 | Netflix | ~$400B | 🇺🇸 USA | Streaming / Media |
| 33 | AbbVie | ~$310B | 🇺🇸 USA | Biopharmaceuticals |
| 34 | Abbott Laboratories | ~$205B | 🇺🇸 USA | Medical Devices |
| 35 | Salesforce | ~$240B | 🇺🇸 USA | CRM / AI Software |
| 36 | Alibaba | ~$250B | 🇨🇳 China | E-Commerce / Cloud |
| 37 | Coca-Cola | ~$295B | 🇺🇸 USA | Beverages / FMCG |
| 38 | Toyota Motor | ~$250B | 🇯🇵 Japan | Automotive |
| 39 | GE Aerospace | ~$230B | 🇺🇸 USA | Aerospace / Defense |
| 40 | AMD | ~$185B | 🇺🇸 USA | Semiconductors / AI Chips |
| 41 | Wells Fargo | ~$245B | 🇺🇸 USA | Banking |
| 42 | SAP SE | ~$255B | 🇩🇪 Germany | Enterprise Software / ERP |
| 43 | PepsiCo | ~$198B | 🇺🇸 USA | Beverages / Snacks |
| 44 | Thermo Fisher Scientific | ~$195B | 🇺🇸 USA | Life Sciences / Tools |
| 45 | ICBC | ~$220B | 🇨🇳 China | Banking (State-owned) |
| 46 | Philip Morris | ~$195B | 🇺🇸 USA | Tobacco / Nicotine |
| 47 | T-Mobile U.S. | ~$275B | 🇺🇸 USA | Telecommunications |
| 48 | Roche Holding | ~$210B | 🇨🇭 Switzerland | Pharma / Diagnostics |
| 49 | Caterpillar | ~$263B | 🇺🇸 USA | Industrial Machinery |
| 50 | Mercado Libre | ~$110B | 🌎 Arg/USA | E-Commerce / LatAm FinTech |
Ranks 51–100 — Defense, Energy, Asia and European Champions
The 51–100 band is where geographic diversity increases markedly, with South Korean, Japanese, Chinese, and European companies anchoring a tier spanning defense contractors, insurance titans, and industrial conglomerates. This segment carries the highest disruption risk — positions in the 60–100 band are frequently reshuffled by earnings surprises, geopolitical developments, and AI sentiment shifts. Our global financial markets report provides additional context.
| Rank | Company | Market Cap | Country | Sector |
|---|---|---|---|---|
| 51 | Linde plc | ~$205B | 🇬🇧 UK/Ireland | Industrial Gases |
| 52 | Booking Holdings | ~$165B | 🇺🇸 USA | Online Travel / Tech |
| 53 | Meituan | ~$120B | 🇨🇳 China | Food Delivery / Super App |
| 54 | RTX Corporation | ~$185B | 🇺🇸 USA | Aerospace / Defense |
| 55 | Intuitive Surgical | ~$175B | 🇺🇸 USA | Medical Robotics |
| 56 | American Express | ~$210B | 🇺🇸 USA | Payments / Financial Services |
| 57 | Goldman Sachs | ~$205B | 🇺🇸 USA | Investment Banking |
| 58 | Morgan Stanley | ~$185B | 🇺🇸 USA | Financial Services |
| 59 | Charles Schwab | ~$155B | 🇺🇸 USA | Brokerage / Wealth Mgmt |
| 60 | Palantir Technologies | ~$175B | 🇺🇸 USA | AI / Defense Software |
| 61 | Lockheed Martin | ~$145B | 🇺🇸 USA | Defense / Aerospace |
| 62 | Honeywell | ~$142B | 🇺🇸 USA | Industrial / Automation |
| 63 | Schneider Electric | ~$153B | 🇫🇷 France | Energy Mgmt / Automation |
| 64 | Shell plc | ~$215B | 🇬🇧 UK | Oil & Gas / Energy |
| 65 | TotalEnergies | ~$155B | 🇫🇷 France | Oil & Gas / Renewables |
| 66 | HSBC Holdings | ~$175B | 🇬🇧 UK | Global Banking |
| 67 | China Construction Bank | ~$180B | 🇨🇳 China | Banking (State-owned) |
| 68 | Agricultural Bank of China | ~$160B | 🇨🇳 China | Banking (State-owned) |
| 69 | PetroChina | ~$150B | 🇨🇳 China | Oil & Gas (State-owned) |
| 70 | Micron Technology | ~$110B | 🇺🇸 USA | Memory / AI Storage |
| 71 | Deere & Company | ~$115B | 🇺🇸 USA | Agricultural Machinery |
| 72 | Shopify | ~$120B | 🇨🇦 Canada | E-Commerce Platform |
| 73 | Texas Instruments | ~$160B | 🇺🇸 USA | Analog / Embedded Chips |
| 74 | Airbnb | ~$83B | 🇺🇸 USA | Travel / Marketplace |
| 75 | Starbucks | ~$103B | 🇺🇸 USA | Food & Beverage / Retail |
| 76 | Sony Group | ~$100B | 🇯🇵 Japan | Electronics / Entertainment |
| 77 | Reliance Industries | ~$200B | 🇮🇳 India | Conglomerate / Telecom |
| 78 | Equinor | ~$72B | 🇳🇴 Norway | Oil & Gas / Renewables |
| 79 | Prologis | ~$98B | 🇺🇸 USA | Industrial Real Estate |
| 80 | Siemens AG | ~$142B | 🇩🇪 Germany | Industrial / Digital Tech |
| 81 | Pinduoduo (PDD) | ~$140B | 🇨🇳 China | E-Commerce / Agriculture |
| 82 | BlackRock | ~$145B | 🇺🇸 USA | Asset Management |
| 83 | Uber Technologies | ~$145B | 🇺🇸 USA | Ride-Sharing / Mobility |
| 84 | AstraZeneca | ~$210B | 🇬🇧 UK/Sweden | Biopharmaceuticals |
| 85 | Qualcomm | ~$155B | 🇺🇸 USA | Mobile Chipsets / AI Edge |
| 86 | Aon plc | ~$80B | 🇬🇧 UK/Ireland | Insurance / Risk Services |
| 87 | HDFC Bank | ~$140B | 🇮🇳 India | Private Banking |
| 88 | Keyence Corporation | ~$85B | 🇯🇵 Japan | Industrial Automation |
| 89 | BYD Company | ~$100B | 🇨🇳 China | Electric Vehicles / Batteries |
| 90 | Anheuser-Busch InBev | ~$90B | 🇧🇪 Belgium | Beverages / Beer |
| 91 | S&P Global | ~$155B | 🇺🇸 USA | Financial Data / Ratings |
| 92 | Intuit | ~$163B | 🇺🇸 USA | Financial Software / AI |
| 93 | ServiceNow | ~$175B | 🇺🇸 USA | Enterprise AI / Cloud |
| 94 | Boeing | ~$179B | 🇺🇸 USA | Aerospace / Defense |
| 95 | 3M Company | ~$76B | 🇺🇸 USA | Industrial / Consumer Products |
| 96 | Marvell Technology | ~$95B | 🇺🇸 USA | AI Networking Chips |
| 97 | NTT Data | ~$55B | 🇯🇵 Japan | IT Services / Cloud |
| 98 | Pernod Ricard | ~$30B | 🇫🇷 France | Spirits / Beverages |
| 99 | Copart Inc. | ~$55B | 🇺🇸 USA | Auto / Online Auctions |
| 100 | Arthur J. Gallagher | ~$71B | 🇺🇸 USA | Insurance Brokerage |
NVIDIA: From Gaming Chip Maker to the World's Most Valuable Company
NVIDIA, with a market cap reaching $4.56 trillion in early 2026, is the world's most valuable company. The company posted quarterly revenue of $68.1 billion, up 94% year-over-year, driven almost entirely by data center demand for its H100 and GB200 Blackwell GPU architecture.
- Biggest customers: OpenAI, Oracle, Google, Microsoft, and Meta Platforms — each spending tens of billions on NVIDIA silicon for large language model training and inference.
- First $4T company: NVIDIA crossed the $4 trillion market cap milestone faster than any company in history — reaching $1T, $2T, $3T, and $4T milestones in rapid succession.
- AI hardware monopoly: The global AI market is anchored by NVIDIA's CUDA ecosystem, which runs on ~3,500 applications and has 15 years of developer entrenchment.
NVIDIA's ascent is not merely about chip performance. The CUDA software ecosystem, built over 15 years and running on approximately 3,500 applications, creates switching costs so high that competitors including AMD, Intel, Google (TPUs), and Amazon (Trainium) have struggled, despite billions invested in alternatives, to meaningfully erode NVIDIA's practical deployment advantage. As the global data center industry accelerates AI infrastructure buildout, NVIDIA sits at the center of every major sovereign AI program, hyperscaler expansion, and enterprise AI rollout.
CUDA software runs on ~3,500 applications. Switching costs for AI developers away from NVIDIA's platform are extraordinarily high — creating what analysts describe as the most defensible technology moat of the modern era. The first mover advantage in AI accelerator software tooling continues to widen the gap in practical deployment, even as AMD, Intel, and hyperscaler custom silicon alternatives attract billions in investment.
U.S. Dominance, Asia's Strength, and Europe's Structural Challenge
U.S. companies in the global top 50 alone exceed $30 trillion in combined market cap — dwarfing every other region. Asia contributes approximately 8 significant names led by TSMC at a multi-trillion valuation and China's Tencent at just under $600 billion. Europe fields approximately 8–10 companies, with luxury houses Hermès and LVMH, pharma champions Novo Nordisk and Roche, and semiconductor equipment monopolist ASML representing the continent's pockets of global leadership.
Six Sectors That Define the Top 100 Market Value Architecture
The chart below visualises the sector breakdown of the world's top 100 companies by combined market cap share. Technology (spanning AI chips, cloud computing, software, and social media) commands more combined value than all other sectors combined. Financial services, healthcare, energy, consumer goods, and industrials each contribute meaningfully but trail technology by an enormous margin that has widened every year since 2020.
The sector dominance breakdown reveals a crucial insight: semiconductors alone — NVIDIA, TSMC, Broadcom, AMD, ASML, Qualcomm) represent more combined market cap than all European companies in the top 100. Healthcare is the clear second-place sector, driven by the GLP-1 drug revolution at Eli Lilly and Novo Nordisk alongside established giants J&J, AbbVie, and AstraZeneca. Energy's representation in the top 100 has fallen from its historic peak, though Saudi Aramco, ExxonMobil, Chevron, and Shell maintain significant positions.
- AI & Semiconductors: NVIDIA ($4.56T), TSMC ($1.2–2T), Broadcom ($1T), AMD ($185B), ASML ($285B), Qualcomm ($155B), Marvell ($95B), Micron ($110B) — the AI chip complex collectively represents more market cap than any national stock exchange outside the U.S.
- Cloud & Enterprise Software: Microsoft Azure, Amazon AWS, Google Cloud, Oracle, Salesforce, ServiceNow, SAP — the infrastructure layer of the AI economy, with Microsoft alone planning ~$100 billion in AI infrastructure spend in 2026.
- Healthcare & GLP-1 Drugs: Eli Lilly and Novo Nordisk have become the pharma world's equivalent of NVIDIA — with GLP-1 obesity drugs projected to generate $150B+ annually by 2030, positioning both for continued top-20 global market cap positions.
- Financial Services: JPMorgan Chase, Visa, Mastercard, Bank of America, Goldman Sachs, American Express — JPMorgan launched its own deposit token (JPMD) in June 2025, signaling the sector's accelerating digital transformation.
- Energy: Saudi Aramco, ExxonMobil, Chevron, Shell, TotalEnergies hold their positions despite energy transition headwinds, supported by strong free cash flow and shareholder return programs.
- Consumer & Retail: Walmart, Costco, Home Depot, Coca-Cola, P&G — defensive, high-cash-flow businesses that anchor the lower tiers of the top 50 with durable earnings visibility across economic cycles.
12 Companies Have Crossed $1 Trillion — A Historic Threshold
When Apple first crossed the $1 trillion market capitalization threshold in August 2018, it stood alone. By April 2026, twelve companies worldwide have crossed this mark — reflecting value creation driven by the AI revolution, cloud computing, GLP-1 pharmaceuticals, and the concentration of global consumer spending in dominant platforms. The U.S. financial markets have been the primary engine of this historic wealth creation.
Magnificent Seven — Alphabet, Amazon, Apple, Meta, Microsoft, NVIDIA, Tesla
The Magnificent Seven collectively represent a market capitalization exceeding $15 trillion as of early 2026 and hold $597 billion in cash reserves. Despite spending heavily to build AI infrastructure, they have financed their buildouts primarily through debt — preserving extraordinary financial optionality. Together, they account for approximately 30% of the S&P 500's total market cap, a concentration with no precedent in U.S. stock market history, visible in our NASDAQ stock market data.
- Apple: Consumer devices — iPhone, Mac, Services ecosystem.
- Amazon: E-commerce + AWS #1 cloud platform. Kuiper satellite broadband expanding.
- Alphabet: Google Search, YouTube, Google Cloud, Gemini AI, Waymo autonomous.
- Microsoft: Azure, ~49% stake in OpenAI, GitHub Copilot, Microsoft 365.
- Meta: Facebook, Instagram, WhatsApp at global scale. Llama AI, Ray-Ban glasses.
- NVIDIA: AI hardware infrastructure — H100, GB200, Blackwell GPU architecture.
- Tesla: Electric vehicles, energy storage, Optimus humanoid robot (strategic pivot 2026). Elon Musk remains the world's wealthiest person.
Largest Companies by Market Cap 2026 — Key Statistics
The chart below tracks market capitalization for the top 10 companies — showing how dramatically the rankings have shifted since 2020. NVIDIA's rise from outside the top 10 to the world's most valuable company in just 4 years is the fastest ascent in stock market history.
| Metric | Value |
|---|---|
| #1 Company — World Market Cap 2026 | NVIDIA — ~$4.56 Trillion |
| #2 Company | Apple — ~$3.95 Trillion |
| #3 Company | Alphabet — ~$3.83 Trillion |
| Total $1T+ Companies | 12 |
| Total Global Market Cap | ~$137.8 Trillion |
| U.S. Share of Top 100 | ~65–70 companies |
| Tech Firms in Top 10 | 8 of 10 |
| Largest Non-U.S. Company | Saudi Aramco (~$1.6T) |
| Largest Asian Company (ex-China) | TSMC — Taiwan (~$1.2–2T) |
| Largest Chinese Company | Tencent (~$590B) |
| NVIDIA Quarterly Revenue (Q3) | $68.1B (+94% YoY) |
| Mag-7 Combined Cash Reserves | ~$597 Billion |
| TSMC U.S. Investment Commitment | $250 Billion |
| Microsoft AI Infra Spend 2026 | ~$100 Billion |
| Europe's Companies in Top 50 | ~8 companies |
| Berkshire Hathaway Class A Share | ~$747,806 per share |
Frequently Asked Questions — Largest Companies by Market Cap 2026
NVIDIA Corporation is the world's most valuable company in 2026, with a market capitalization of approximately $4.56 trillion as of early 2026. NVIDIA became the first company ever to reach the $4 trillion market cap milestone, driven by record demand for its AI accelerator chips from hyperscalers, enterprises, and sovereign AI programs worldwide. Apple follows in second place at approximately $3.95 trillion.
As of April 2026, 12 companies have a market capitalization of at least $1 trillion: NVIDIA (~$4.56T), Apple (~$3.95T), Alphabet (~$3.83T), Microsoft (~$3.53T), Amazon (~$2.49T), TSMC (~$1.2–$2T), Saudi Aramco (~$1.6T), Meta Platforms (~$1.4T), Tesla (~$1.1T), Berkshire Hathaway (~$1.0T+), and Broadcom (~$1.0T). Walmart is approaching the threshold from below at approximately $780B.
The United States dominates the global top 100, accounting for approximately 65–70 companies. U.S. companies in the global top 50 alone command market capitalizations exceeding $30 trillion. China ranks second with approximately 10–12 companies. Europe contributes approximately 8–10 companies across semiconductors equipment, luxury goods, pharma, and energy sectors. See our world GDP data for the economic context behind these rankings.
Technology — specifically AI-related technology — dominates the global top 10, with 8 of the top 10 positions held by tech companies. NVIDIA (AI chips), Apple (consumer devices), Alphabet (AI/search/cloud), Microsoft (AI/cloud/software), Amazon (e-commerce/cloud), TSMC (chip manufacturing), Meta Platforms (social/AI), and Broadcom (custom AI chips) all fall within the technology sector. The only non-tech top 10 members are Saudi Aramco (energy) and Berkshire Hathaway (conglomerate).
The total market capitalization of all publicly listed companies worldwide stands at approximately $137.8 trillion as of early 2026, according to CompaniesMarketCap data tracking 10,639 listed companies. This represents a dramatic increase from approximately $90 trillion in 2020, driven by the AI investment boom, post-pandemic equity recovery, and sustained earnings growth among technology and healthcare leaders.
NVIDIA's ascent was driven by unprecedented demand for its GPU chips used in AI model training and inference. The company posted $68.1 billion in quarterly revenue in early 2026, up 94% year-over-year. Its CUDA software ecosystem — 15 years in development and running on ~3,500 applications — creates switching costs so high that even trillion-dollar competitors cannot displace it. Sovereign AI programs from Saudi Arabia, UAE, France, Japan, and India create additional demand insulated from normal enterprise tech cycles. Read our fulhttps://businesstats.com/millionaires-in-the-us/-the-world/">AI market size analysis for context.
In early 2026, the non-U.S. companies ranking in or near the global top 10 are TSMC (Taiwan, ~$1.2–2 trillion) and Saudi Aramco (Saudi Arabia, ~$1.6 trillion). Both are among the very few non-American firms to consistently hold top-10 positions amid strong U.S. tech dominance. TSMC's position reflects global strategic dependence on advanced semiconductor manufacturing; Saudi Aramco's reflects its status as the world's largest daily oil producer.
Yes. Palantir Technologies has risen into the global top 100 in 2026, with a valuation of approximately $175 billion, driven by explosive growth in its U.S. Government and commercial AI platform segments. Palantir's AIP (Artificial Intelligence Platform) has been adopted by major U.S. defense agencies and enterprise clients, driving revenue growth well above expectations and triggering a significant re-rating of its equity valuation. It sits around rank 60 in the global market cap hierarchy.
Europe's highest-market-cap company in 2026 is ASML (Netherlands), the world's sole manufacturer of extreme ultraviolet (EUV) lithography machines — critical for producing the most advanced AI semiconductors. Despite announcing job cuts in early 2026, ASML's EUV monopoly position keeps it as Europe's most strategically indispensable listed company. Novo Nordisk (Denmark), SAP (Germany), Hermès (France), and AstraZeneca (UK) also rank among Europe's top companies by market cap.
Market capitalization is calculated by multiplying a company's current share price by the total number of outstanding shares. If a company has 10 billion shares outstanding and each trades at $400, its market cap is $4 trillion. Market cap fluctuates continuously during trading hours. It is distinct from enterprise value (which accounts for debt and cash) and from revenue or profit. A company can have a high market cap while still being unprofitable if investors expect large future earnings — relevant context for our stock market terminology guide.
The Magnificent Seven are the seven dominant U.S. mega-cap technology companies: Alphabet, Amazon, Apple, Meta Platforms, Microsoft, NVIDIA, and Tesla. As of early 2026, they collectively represent a market capitalization exceeding $15 trillion and hold $597 billion in cash reserves. Together they account for approximately 30% of the S&P 500's total market cap — a concentration without precedent in U.S. stock market history. The group spans AI chips, cloud computing, consumer devices, social media, e-commerce, and EVs.
The primary risks include: AI investment bubble (if AI revenue does not justify infrastructure costs), antitrust regulation (EU and U.S. regulators are actively investigating Magnificent Seven companies), U.S.-China trade escalation (affecting NVIDIA chip export restrictions and Chinese company valuations), interest rate environment (higher rates reduce the present value of future earnings, compressing tech valuations), and geopolitical disruption to semiconductor supply chains — particularly TSMC's Taiwan exposure and the concentration of semiconductor manufacturing in a single geography.