Global Sports Brands — $190 Billion Market in 2026
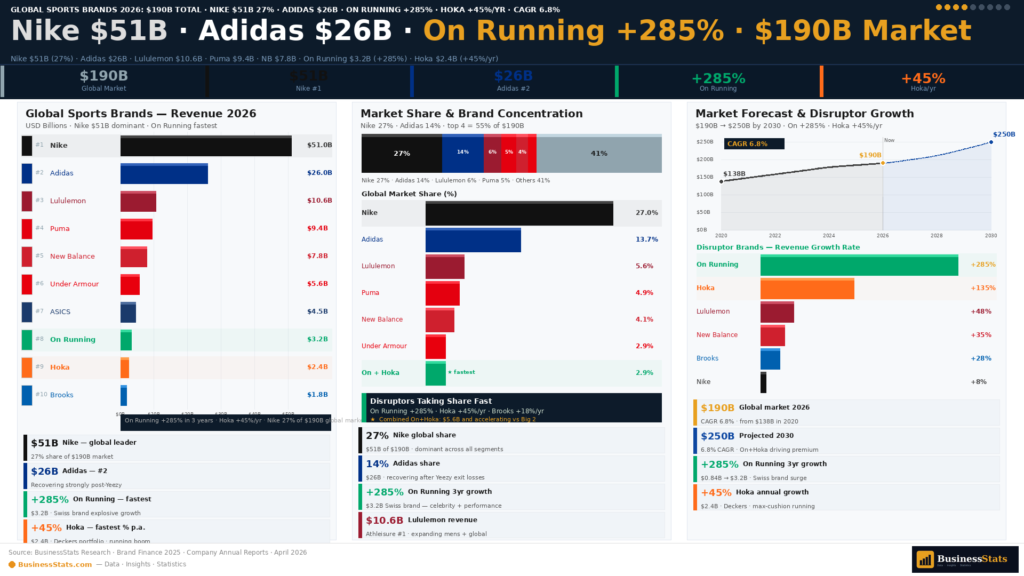
The global sportswear and sports brands market reached approximately $190 billion in 2026, growing at a CAGR of 6.8% and projected to reach $250 billion by 2030. The market is defined by extraordinary concentration at the top — Nike alone represents approximately 27% of global sportswear value — and extraordinary dynamism at the challenger tier, where On Running, Hoka, and Lululemon are among the fastest-growing consumer brands of any category globally. The broader context of global sports brand revenues connects to our analysis of the world's most valuable companies, where Nike consistently ranks in the global top 30.
- Global market: ~$190B in 2026 · CAGR 6.8% · projected $250B by 2030
- Nike dominance: ~27% of global sportswear market by value — nearly 2× Adidas
- Regional split: North America 37% · Europe 28% · Asia-Pacific 26% · Rest of World 9%
- Fastest growing region: Asia-Pacific at 9.2% CAGR — China, India, Southeast Asia driving volume
- Key structural shift: DTC (direct-to-consumer) now ~35% of all major brand revenues — up from 18% in 2018
Three mega-trends define the global sports brands landscape in 2026. First, the DTC revolution: brands cutting wholesale relationships to build owned digital and retail channels, improving margins while gaining customer data. Second, the running specialty renaissance: Nike and Adidas are losing running shoe market share to specialty players (On, Hoka, Brooks, ASICS) who are winning with superior technology and community-driven marketing. Third, the athleisure permanence: the pandemic-era shift to wearing performance apparel everywhere has become structural — Lululemon's extraordinary growth proves that premium, lifestyle-positioned sportswear has become a permanent consumer staple. The sports brand ecosystem intersects with the detailed Nike revenue history and sports drinks market as part of the broader active lifestyle economy.
- DTC trend: Nike 40% DTC · Adidas targeting 50% DTC · Lululemon 90%+ DTC — industry transformation
- Running specialty: On Running, Hoka, Brooks collectively growing 30%+ — taking share from Nike/Adidas in run category
- Athleisure permanence: Lululemon +220% in 5 years · Vuori, Alo Yoga, Gymshark all growing 30%+
- Social commerce: TikTok shop, Instagram shopping driving 15–20% of new brand discovery for Gen Z buyers
The Big Three — Nike, Adidas & Puma by the Numbers
Nike is the world's largest sports brand by almost every measure — revenue, brand value, market capitalization, and cultural influence. In fiscal year 2025 (ending May 31, 2025), Nike generated approximately $51 billion in global revenue, operating across 190+ countries. Nike's U.S. revenue alone (~$20B) exceeds the entire global revenue of Adidas' #2 competitor Under Armour, New Balance, and Puma combined. Despite this scale, Nike faces its most significant competitive challenge in two decades — losing running shoe market share to specialty brands, facing DTC execution growing pains, and navigating a brand relevance challenge with Gen Z who increasingly favor smaller, more "authentic" brands. The Nike global revenue history since 2005 shows the brand's extraordinary 20-year growth trajectory.
- Nike global revenue FY2025: ~$51B · 190+ countries · ~$53B brand value (Brand Finance 2025)
- Nike U.S. revenue: ~$20B · 48% of U.S. athletic footwear market · DTC 40% of U.S. revenue
- Nike Jordan Brand: ~$6.5B global revenue · sneaker culture icon · highest resale premiums
- Nike direct digital: Nike.com + SNKRS app — growing 20%+ annually · 160M+ Nike Member accounts
- Nike challenge 2026: Losing running specialty share to On/Hoka/Brooks · Gen Z brand relevance declining
Adidas — the world's #2 sports brand at approximately €24.2 billion (~$26B USD) in 2025 — has delivered one of the most dramatic corporate recovery stories in recent sports industry history. The Yeezy controversy (Kanye West antisemitic statements, October 2022) cost Adidas approximately $700 million in inventory write-downs and an estimated $1.3 billion in unsold inventory. By 2025, Adidas had largely resolved the Yeezy situation (selling remaining inventory with charitable donations) and is growing +18% in revenue — driven entirely by the retro sneaker boom: the Samba, Gazelle, Handball Spezial, and Superstar models are all cultural phenomena simultaneously, a rare multi-model alignment.
- Adidas FY2025 revenue: €24.2B (~$26B) · +18% growth · headquartered Herzogenaurach, Germany
- Yeezy total impact: ~$1.3B inventory left over · ~$700M net write-down · 2022–2023 crisis
- Adidas Samba: Most searched sneaker globally in 2024 · representing cultural peak of retro trend
- Adidas Gazelle: $200–250 retail · selling at 180% on resale · Gen Z's current favorite silhouette
- Adidas Three-Phase Plan (2021–2025): "Own the game" strategy — DTC acceleration + North America recovery
Puma — the world's #3 sports brand at approximately €9.1 billion (~$9.4B USD) in 2025 — is majority-owned by Kering, the French luxury conglomerate (also owner of Gucci, Balenciaga, and Saint Laurent). Puma has successfully navigated its positioning as the more playful, fashion-forward sports brand — with celebrity collaborations (Rihanna's Fenty Puma, Neymar Jr.) and football/soccer heritage driving cultural relevance. Puma holds strong positions in football (soccer) boots, motorsport/Formula 1 apparel, and running. Its basketball presence is growing through NBA and college partnerships. The global brand value dynamics are tracked in our world's most valuable companies analysis.
Top Sports Brands — Global Revenue Comparison 2025 (USD Billion)
The navy bar chart ranks the top sports brands globally by fiscal year 2025 revenue. Nike's $51B dominance is visually striking — it is nearly double Adidas' $26B and more than five times Puma's $9.4B. The chart reveals the extraordinary growth of Lululemon ($10.6B), which has now surpassed Under Armour ($5.7B) and is approaching Puma in total revenue despite being founded only in 1998.
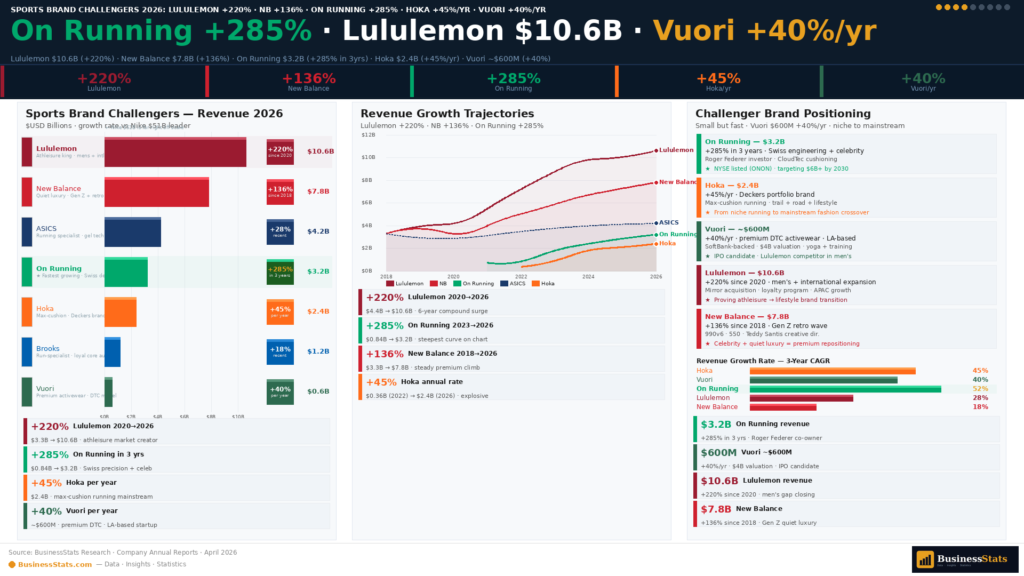
Rising Challengers — Lululemon, New Balance, On Running & Hoka
Lululemon is arguably the most successful sports brand launch of the 21st century. Founded in Vancouver in 1998 by Chip Wilson, the brand pioneered the premium athleisure category and has grown from $3.3 billion in revenue (2020) to approximately $10.6 billion in FY2025 — a 220% increase in five years. Lululemon now operates 720+ stores globally, commands an average selling price premium of approximately 60% above Nike and Adidas in comparable performance apparel categories, and has brand loyalty metrics (Net Promoter Score 80+) that rival Apple's. U.S. revenue represents approximately 57% of total ($6.0B), with international (particularly China, UK, and Canada) growing fastest at 35% annually. The brand's social media driven growth is documented in our Instagram market analysis.
- Lululemon revenue FY2025: $10.6B global · +220% since 2020 · 720+ stores · 90%+ DTC
- Lululemon NPS: 80+ (Apple-tier loyalty) · highest in sportswear industry
- Lululemon international: Growing 35% annually · China fastest single market
- Lululemon men's: Now ~25% of revenue · one of most successful gender category expansions in sportswear
- Lululemon footwear: Launched 2022 · still <5% of revenue · major growth opportunity being pursued
New Balance's transformation from a niche, unglamorous running brand to a global cultural phenomenon is one of the most studied brand turnarounds in history. Revenue grew from approximately $3.3 billion in 2018 to $7.8 billion in 2025 — a 136% increase in 7 years. The catalyst was Gen Z's embrace of the "dad shoe" aesthetic, initially driven by celebrities wearing New Balance 574s and 990s, then amplified through social media. New Balance has skillfully navigated the balance between performance credibility (it still makes all its premium "Made in USA" shoes domestically) and cultural relevance (collaborating with Teddy Santis as creative director). The YouTube creator economy and social media platforms have been central to New Balance's discovery by new consumers.
- New Balance FY2025: ~$7.8B global revenue · privately held (Jim Davis family) · Boston-headquartered
- NB growth: $3.3B (2018) → $7.8B (2025) — +136% in 7 years; fastest major brand by revenue growth rate
- Made in USA: Premium 990 series made in Norridgewock, Maine · $185–$250 retail · halo brand positioning
- NB collaborations: Joe Freshgoods, Aime Leon Dore, Teddy Santis (creative director) — elevated cultural positioning
- NB 550: Became #1 selling lifestyle sneaker in multiple markets 2023–2024 · basketball silhouette gone lifestyle
On Running (On AG, Swiss brand) is the most dramatic growth story in global running — and potentially in all of sportswear. Revenue grew from $832 million in 2022 to approximately $3.2 billion in 2025 — a 285% increase in just 3 years. On went public (NYSE: ONON) in September 2021 at a $7.3B valuation and has since traded as high as a $22B market cap. Tennis legend Roger Federer is both an investor and brand ambassador — his association has been central to On's premium, performance-meets-lifestyle positioning. Hoka (owned by Deckers Brands) followed a parallel path — its maximalist cushioning technology attracted elite marathoners, then healthcare workers, then mainstream consumers, growing from $900M in 2022 to approximately $2.4 billion in FY2025 at +45% annually. Together, On and Hoka have fundamentally disrupted Nike and Adidas's dominance in the premium running segment. The e-commerce strategies of these brands are analyzed in our global e-commerce growth report.
Sports Brands — Revenue Growth Comparison 2020–2025
The line chart below tracks revenue growth for the sport brand industry's key challengers from 2020 to 2025. Lululemon, On Running, and New Balance show growth trajectories that dwarf the industry averages. Nike's flat/declining trend reflects the challenges facing incumbent leaders when upstarts disrupt both product category and go-to-market strategy.
Nike's $51 billion in global annual revenue exceeds the combined total of the next five largest sports brands — Adidas ($26B) + Puma ($9.4B) + Lululemon ($10.6B) + New Balance ($7.8B) + Under Armour ($5.7B) = approximately $59.5 billion... which actually edges ahead of Nike slightly. But Nike's brand value of $53 billion (Brand Finance 2025) is approximately 3× Adidas' $16B brand value — illustrating how Nike's intangible brand equity represents a moat that revenue figures alone don't fully capture. One major contributing factor: Nike spends approximately $3.5–4B annually on marketing — more than many competitors' total revenues. The global brand dynamics are tracked further in our world's most valuable companies analysis and global consumer economy overview.
Sports Brands — Complete Revenue Rankings & Data Table 2025/26
Top 15 Sports Brands Ranked by Global Revenue 2025
The sortable table below ranks 15 major global sports brands by annual revenue, market share, growth rate, and brand value. Click any column header to sort. All revenues are in USD at approximate 2025 exchange rates.
| Brand | Global Revenue | Global Share (%) | YoY Growth | Brand Value | HQ / Owner |
|---|---|---|---|---|---|
| Nike (incl. Jordan, Converse) | ~$51.0B | ~27% | −2.1% | ~$53B | Beaverton, OR / Public |
| Adidas | ~$26.0B | ~14% | +18.0% | ~$16B | Herzogenaurach / Public |
| Decathlon | ~$18.4B | ~10% | +6.5% | ~$7B | Villeneuve-d'Ascq / Private |
| Lululemon | ~$10.6B | ~6% | +11.0% | ~$9B | Vancouver / Public |
| Puma | ~$9.4B | ~5% | +4.8% | ~$5B | Herzogenaurach / Kering 86% |
| New Balance | ~$7.8B | ~4% | +14.0% | ~$4B | Boston, MA / Private |
| Columbia Sportswear | ~$3.7B | ~2% | +4.2% | ~$2B | Portland, OR / Public |
| On Running (On AG) | ~$3.2B | ~2% | +42.0% | ~$8B | Zurich / Public (ONON) |
| ASICS | ~$4.2B | ~2% | +18.0% | ~$2B | Kobe, Japan / Public |
| Under Armour | ~$5.7B | ~3% | −3.5% | ~$3B | Baltimore, MD / Public |
| Hoka (Deckers) | ~$2.4B | ~1% | +45.0% | ~$5B | Goleta, CA / Public (DECK) |
| Brooks Running | ~$1.2B | ~1% | +12.0% | ~$1B | Seattle, WA / Berkshire Hathaway |
| Fila | ~$1.8B | ~1% | +5.5% | ~$1B | Seoul, Korea / Fila Holdings |
| Reebok | ~$2.5B | ~1% | +8.0% | ~$2B | Boston, MA / Authentic Brands |
| Li-Ning (China) | ~$3.8B | ~2% | +9.0% | ~$3B | Beijing / Public (HK) |
Sports Brands — Global Market Share 2026 (Donut)
The donut visualization shows global sportswear market share concentration. Nike's 27% and Adidas' 14% together represent 41% of the global market — a duopoly that has slowly eroded from a combined 48% in 2015 as specialist challengers, regional brands, and private label options have gained ground.
Sports Brand Strategies & Trends — DTC, Social Commerce & Sustainability
The most consequential strategic shift in sports brands is the DTC (direct-to-consumer) revolution. Nike pioneered this by terminating wholesale relationships with Amazon (2019), DSW (2020), Urban Outfitters (2021), and dozens of other accounts — accepting short-term revenue pain for long-term margin improvement and customer data ownership. The results are compelling: Nike's DTC gross margin (~45%) is significantly above its wholesale gross margin (~35%), and its 160M+ Nike Member accounts provide unprecedented consumer insight for product development and personalized marketing. Adidas targets 50% DTC by 2027, Lululemon already operates at 90%+ DTC, and even New Balance has invested heavily in owned retail and e-commerce. The Amazon marketplace dynamics and global e-commerce growth provide context on why brands are increasingly seeking to bypass third-party platforms.
- Nike DTC share: 40% of U.S. revenue · 160M+ Nike Members · growing 20%+ annually
- Adidas DTC target: 50% DTC by 2027 · currently ~38% · Adidas app growing 35% annually
- Lululemon DTC model: 90%+ DTC (owned stores + lululemon.com) · highest margin sportswear brand
- On Running DTC: ~45% online direct · Swiss premium positioning · avoiding mass retail channels
- Industry DTC trend: From 18% average (2018) to 35% average (2026) — structural channel shift
Social commerce and influencer marketing have become primary brand-building tools for sports brands — particularly for challengers. Gymshark ($700M+ revenue) was built almost entirely through fitness influencer partnerships on Instagram and YouTube before taking a single dollar of traditional advertising. Vuori ($600M+, growing 40%+ annually) similarly credits social media for its extraordinary organic growth. Even established giants have shifted: Nike's SNKRS app uses social media-style drops and community engagement to drive scarcity and demand for premium footwear. The influencer economy's role in sports brand discovery is documented in our Instagram statistics report and YouTube market analysis.
- Gymshark: ~$700M revenue · built entirely on fitness influencers · 0 traditional ads in first 5 years
- Vuori: ~$600M revenue · growing 40%+ · premium yoga/outdoor aesthetic · California-based
- Alo Yoga: ~$500M revenue · luxury athleisure positioning · 35M+ Instagram followers
- TikTok "SportsTok": 15–20% of Gen Z sports brand discovery now happens on TikTok — reshaping brand marketing spend
- Nike SNKRS app: 50M+ downloads · exclusive drops · community-driven scarcity model for premium footwear
Sports Brands — Revenue Share by Product Category 2026
The AUV bars below show how the global sportswear market splits by product category. Athletic footwear leads at 43% — reflecting both its higher price points and the cultural significance of sneakers as fashion/status items beyond pure sport functionality.
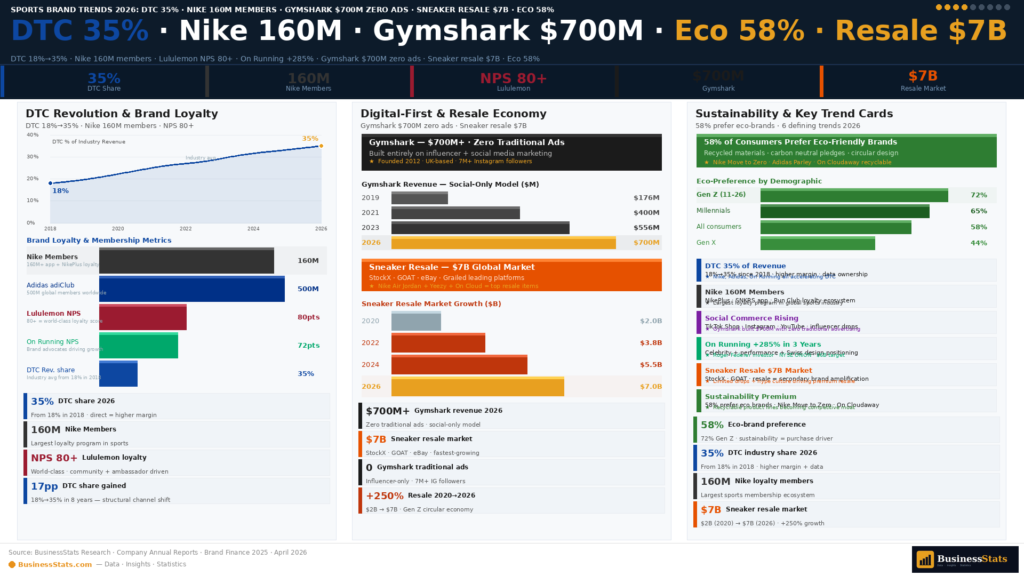
Sustainability has moved from a niche preference to a mainstream purchase driver. 58% of global sportswear consumers say they prefer brands with genuine environmental commitments (Mintel 2025). Nike's Move to Zero initiative targets zero carbon and zero waste, with 35%+ of Nike products already containing recycled materials. Adidas' Stan Smith Mylo (made from mushroom leather) and Parley collection (ocean plastic) have generated significant consumer interest. Patagonia's 1% for the Planet pledge and repair program have made sustainability a genuine competitive differentiator for the outdoor brand. Decathlon has committed to making 100% of its products from sustainable materials by 2026 — an extraordinary pledge given its scale ($18.4B revenue).
- Nike Move to Zero: 35%+ products with recycled materials · targeting carbon neutral by 2030
- Adidas Parley: Ocean plastic collection · 30M+ pairs sold · mainstream eco-conscious positioning
- Patagonia repair pledge: "Don't Buy This Jacket" anti-consumerism campaign · 1% for Planet donor
- Decathlon sustainability: 100% sustainable materials target for all products by 2026 · circular economy model
- Sneaker resale: $7B global market (StockX, GOAT, eBay) — sustainability concern driving resale market growth
Sports Brands — Key Statistics & Facts 2026
Global Sports Brands Market — Forecast & Outlook 2026–2030
The global sportswear and sports brands market is projected to reach approximately $250 billion by 2030 at a CAGR of 6.8%. Four macro forces drive this forecast — and all are accelerating. The broader consumer economy context is tracked in our global GDP and consumer spending analysis.
- Asia-Pacific expansion: China, India, Southeast Asia — combined 9.2% CAGR · emerging middle class entering premium sportswear for the first time
- Women's sports boom: Paris 2024 Olympics, WNBA, women's soccer driving female athlete visibility and brand investment
- Running specialty surge: On, Hoka, Brooks collectively projected to reach $12B+ by 2029 — continuing to take share from Nike/Adidas in performance run
- Athleisure permanence: Lululemon, Vuori, Alo Yoga projected to collectively reach $20B+ by 2029 — premium casual sportswear becoming a permanent lifestyle category
Key risks include Nike's DTC transition execution risk (if the brand loses too much wholesale distribution before DTC fully compensates), Adidas' reliance on retro sneaker cycles (Samba/Gazelle trends will eventually peak), and macroeconomic pressure on discretionary consumer spending in key markets. The Li-Ning and Anta opportunity (Chinese domestic sports brands) represents a wildcard — both brands are growing rapidly in China and beginning to internationalize, which could significantly reshape the global brand landscape by 2030. The broader financial market context is tracked in our U.S. financial markets analysis.
- Risk 1 — Nike DTC: Wholesale channel revenue may not be fully replaced by DTC fast enough — near-term revenue gap risk
- Risk 2 — Adidas retro peak: Samba/Gazelle trends will plateau — question is what comes next in Adidas product pipeline
- Risk 3 — Chinese brands: Li-Ning, Anta, Peak expanding internationally — potential threat to Nike/Adidas Asia-Pacific dominance
- Upside — India: 1.4B population, rising incomes, sports culture explosion — could rival China as sportswear growth market by 2030
- Upside — AI personalization: Nike and Adidas investing in AI-driven product customization and personalized marketing at scale
Frequently Asked Questions — Sports Brands 2026
Nike is the world's largest sports brand by revenue, generating approximately $51 billion in global annual sales in fiscal year 2025. Nike's global revenue is nearly double that of its nearest competitor, Adidas ($26B). Nike operates in 190+ countries and holds approximately 27% of the global sportswear market by value. Nike's brand value alone — estimated at approximately $53 billion by Brand Finance in 2025 — makes it one of the 10 most valuable brands globally across all categories, not just sports.
Adidas generated approximately €24.2 billion (~$26 billion USD) in global net sales in fiscal year 2025 — achieving +18% revenue growth in its strongest year since 2021. This represents a remarkable recovery from the Yeezy crisis (2022–2023), which cost the brand an estimated $700 million in inventory write-downs. The recovery has been driven primarily by the retro sneaker boom: the Adidas Samba, Gazelle, Handball Spezial, and Superstar models are all simultaneously in high cultural demand — a multi-model alignment rarely seen in sneaker history. Adidas holds approximately 14% of the global sportswear market.
The global sportswear and sports brands market reached approximately $190 billion in 2026, growing at a CAGR of 6.8% and projected to reach approximately $250 billion by 2030. The market includes athletic footwear (~43% of value), performance apparel (~35%), and sports equipment and accessories sold under branded sports labels (~22%). Regional breakdown: North America 37%, Europe 28%, Asia-Pacific 26%, Rest of World 9%. Asia-Pacific is the fastest-growing region at 9.2% CAGR, driven by rising incomes and sports culture adoption in China, India, and Southeast Asia.
Lululemon generated approximately $10.6 billion in global revenue in fiscal year 2025 — representing a 220% increase from $3.3 billion in fiscal year 2020. This makes Lululemon one of the fastest-growing major consumer brands globally over a five-year period. U.S. revenue accounts for approximately 57% of total (~$6.0B), with international markets (particularly China, UK, and Canada) growing fastest at 35% annually. Lululemon operates 720+ stores globally and generates approximately 90%+ of revenue through DTC channels (owned stores + lululemon.com) — the highest DTC ratio of any major sports brand.
Adidas terminated its decade-long Yeezy partnership with Kanye West (Ye) in October 2022 following his antisemitic public statements. The termination left Adidas with approximately $1.3 billion in unsold Yeezy inventory, resulting in an estimated $700 million net impact on revenue and profits in 2022–2023. Adidas has since sold the majority of remaining Yeezy inventory across multiple "drops," donating a significant portion of proceeds to anti-hate organizations including the Anti-Defamation League. By 2025, Adidas had fully recovered — achieving +18% revenue growth driven by the retro sneaker boom (Samba, Gazelle, Handball Spezial). The Yeezy crisis is now largely resolved, though the brand relationship between Adidas and Kanye West is permanently terminated.
New Balance has delivered one of the most remarkable growth trajectories in sports brand history. Revenue grew from approximately $3.3 billion in 2018 to approximately $7.8 billion in 2025 — a 136% increase in just 7 years. The brand pivoted from a niche running specialty brand to a global lifestyle phenomenon, with models like the 574, 990, and 550 becoming cultural staples particularly among Gen Z and Millennials worldwide. New Balance is privately held by the Jim Davis family (Bostonian founders) — meaning it can make long-term strategic decisions without quarterly earnings pressure. The brand's Made in USA premium 990 series (retailing $185–$250) provides a unique domestic manufacturing story that resonates with consumers seeking brand authenticity.
On Running (On AG) generated approximately $3.2 billion in global revenue in 2025, growing at approximately +42% year-over-year — making it the fastest-growing major sports brand globally. On grew from $832 million in 2022 to $3.2 billion in 2025 — a 285% increase in just 3 years. The Swiss brand went public in September 2021 (NYSE: ONON) at a $7.3B valuation and has traded at market caps as high as $22B. Tennis legend Roger Federer is both an investor (holding a significant stake) and brand ambassador. On's proprietary CloudTec cushioning technology and "Swiss engineering meets performance running" positioning have created a premium halo that commands 25–40% price premiums above Nike and Adidas equivalents.
Among established brands with over $1B in revenue, On Running (+42% annually, +285% in 3 years) and Hoka (+45% annually) are the fastest growing. Among smaller brands crossing into mid-size, Vuori (+40% annually) and Alo Yoga (+35% annually) are standouts in premium athleisure. Among major brands, Lululemon (+220% in 5 years) has the most sustained multi-year growth record of any brand with over $5B in revenue globally. In terms of CAGR over the 2020–2025 period, On Running's approximately 80% CAGR (from pre-IPO private revenues) is almost certainly the highest of any brand with meaningful global scale.
Nike is consistently ranked the world's most valuable sports brand by major brand valuation firms. Brand Finance estimated Nike's brand value at approximately $53 billion in 2025 — making it one of the 10 most valuable brands globally across all categories. Adidas is #2 at approximately $16 billion in brand value — meaning Nike's brand value is approximately 3× that of Adidas. Lululemon ranks #3 in sports brand value at approximately $9 billion — an extraordinary valuation for a brand founded in 1998 that has only been global for ~10 years. Nike's brand value ($53B) actually exceeds its annual revenue ($51B) — a rare indicator of just how powerful its consumer franchise is.
Puma generated approximately €9.1 billion (~$9.4 billion USD) in global revenue in FY2025, making it the world's #3 sports brand by revenue. Puma is approximately 86% owned by Kering SA, the French luxury goods conglomerate also responsible for Gucci, Balenciaga, Saint Laurent, and Bottega Veneta. Kering has owned Puma since 2007. Despite the luxury ownership, Puma is managed as an independent sports and lifestyle brand. Key Puma strengths include football/soccer boots (sponsoring major clubs), Formula 1 motorsport apparel (Ferrari, Mercedes team kits), and celebrity collaborations like Rihanna's Fenty Puma and Neymar Jr. partnerships.
Nike spends approximately $3.5–4 billion annually on marketing and demand creation — more than many competitors' total annual revenues. This spending covers athlete endorsements (LeBron James, Cristiano Ronaldo, Serena Williams, and hundreds more), league/team sponsorships (NFL, NBA, MLB, Premier League, Champions League), advertising campaigns, and retail marketing. Nike's athlete endorsement roster is the largest in sports — the brand sponsors athletes across virtually every major sport and in every major market. Nike's SNKRS app and Nike+ membership program (160M+ members) have become increasingly important marketing channels that allow personalized, direct-to-member communication without paid media costs.
Under Armour generated approximately $5.7 billion in global revenue in fiscal year 2025 — down −3.5% year-over-year as the brand continues its turnaround effort. Under Armour is refocusing on premium performance positioning, cutting mass-market distribution channels (reducing SKU count by 25%+) to improve brand perception and margins. The brand maintains strong positions in football apparel (NFL partnerships), basketball (Stephen Curry brand), and running (HOVR technology). Its North American revenue ($3.5B) is its core market but has been declining. Under Armour's connected fitness platform (MapMyRun, MapMyFitness — 200M+ registered users) represents a unique digital asset not yet fully monetized.
The global sneaker resale market reached approximately $7 billion in 2026, growing at approximately 12% annually. The U.S. market alone is estimated at approximately $2.5 billion. The two leading platforms are StockX (Detroit-based, authentication-first, stock market-style pricing) and GOAT (Los Angeles-based, broader luxury goods expansion). Nike's Jordan Brand and limited-edition Adidas collaborations (Pharrell Williams, Bad Bunny, Sean Wotherspoon) drive the highest premiums — some pairs sell at 500–1000% of retail price. Resale is now a mainstream channel for 18–35 year olds, with approximately 1 in 4 Gen Z sneaker buyers having purchased on a resale platform in 2025.
Top sports brand trends in 2026: (1) DTC acceleration — industry average DTC now 35%, heading to 50%+ by 2030; (2) Running specialty disruption — On, Hoka, Brooks collectively taking significant share from Nike/Adidas in premium run; (3) Retro sneaker cycles — Adidas Samba/Gazelle, New Balance 550/574 defining lifestyle footwear; (4) Women's sports investment — all major brands allocating 50%+ of product development to women's; (5) Social commerce — TikTok and Instagram driving 15–20% of Gen Z brand discovery; (6) Athleisure permanence — Lululemon, Vuori, Alo permanently expanding the category; (7) Sustainability pressure — 58% of consumers prefer eco-friendly brands; (8) Asia-Pacific premiumization — China, India becoming major premium sportswear markets.
Reebok is currently owned by Authentic Brands Group (ABG), which acquired it from Adidas in February 2022 for approximately $2.5 billion. Adidas had originally purchased Reebok in 2006 for $3.8 billion, but the acquisition was largely considered unsuccessful as Reebok lost market share throughout the period. Under ABG ownership, Reebok has refocused on its fitness heritage (CrossFit, aerobics, gym culture), classic retro footwear (Classic Leather, Club C, Freestyle), and collaborations. ABG also owns other major sports and lifestyle brands including Sports Illustrated, Nautica, and Brooks Brothers. Reebok generates approximately $2.5 billion in global annual revenue under ABG's licensing-based management model.
