Unlock full access to: Netflix Marketing Spend 2017-2026 – $3.30B in 2025, Up 13.2%. After purchase, return to the article to read the complete content.
$ 3
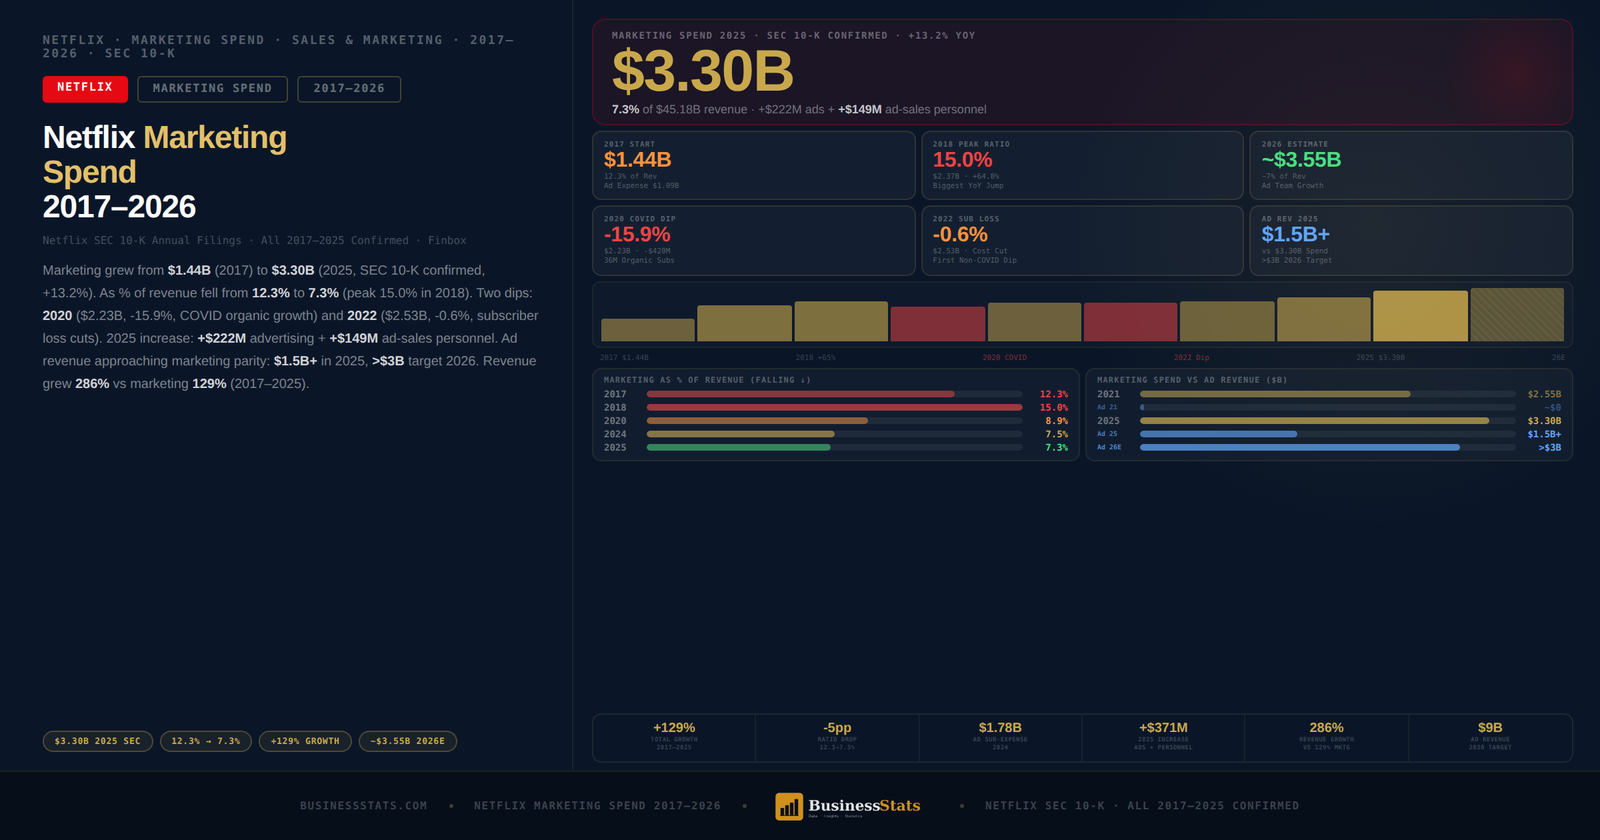
Full access to: Netflix Marketing Spend 2017-2026 – $3.30B in 2025, Up 13.2%
Unlock full access to: Netflix Marketing Spend 2017-2026 – $3.30B in 2025, Up 13.2%. After purchase, return to the article to read the complete content.
You must be logged in to post a review.

Senior data researcher at BusinessStats.com specializing in global market intelligence, industry forecasting, and business statistics across 170+ industries. Work cited by analysts and professionals in over 150 countries.
Reviews
There are no reviews yet.