BRICS+ Countries 2025 — The Emerging World's Answer to Western Economic Dominance
The BRICS+ bloc in 2025 represents far more than an economic statistic — it is the institutional expression of a fundamental shift in global power dynamics. When Goldman Sachs analyst Jim O'Neill coined "BRIC" in 2001, he identified Brazil, Russia, India, and China as the four emerging markets most likely to reshape the global economy over the following decades. His forecast has proven broadly correct: BRICS+ countries now account for 35% of global GDP in purchasing power parity terms, surpassing the G7's 30% share — a milestone that would have seemed implausible when the G7 controlled 65% of world GDP in 1990. The formal expansion of BRICS in January 2024 — adding Egypt, Ethiopia, Iran, Saudi Arabia, and the UAE — and Indonesia's accession in January 2025 transformed a four-nation economic coordination forum into a ten-nation geopolitical bloc spanning the world's most strategically critical regions: the Persian Gulf, East Africa, South Asia, South America, and East Asia.
The economic weight of BRICS+ countries is most visible in three domains. First, demographic and labor force dominance: BRICS+ nations hold 3.6 billion people — 45% of humanity — with the world's largest and fastest-growing working-age populations (India, Indonesia, Ethiopia, Egypt) that represent the primary source of global labor force growth through 2040. Second, natural resource control: BRICS+ members collectively hold approximately 44% of global oil output, 60% of proven oil reserves, 40% of natural gas production, and dominant shares of critical minerals essential for the green energy transition (lithium in Brazil, cobalt in the DRC, rare earths in China). The broader global economy is therefore deeply dependent on BRICS+ resource exports — a leverage that member nations are increasingly using strategically. Third, manufacturing and export capacity: China alone accounts for approximately 14% of world merchandise exports; add India, Brazil, Russia, and the new members, and BRICS+ represents approximately 25% of global trade.
BRICS+ Member Countries 2025 — Who Is In, Who Is Watching
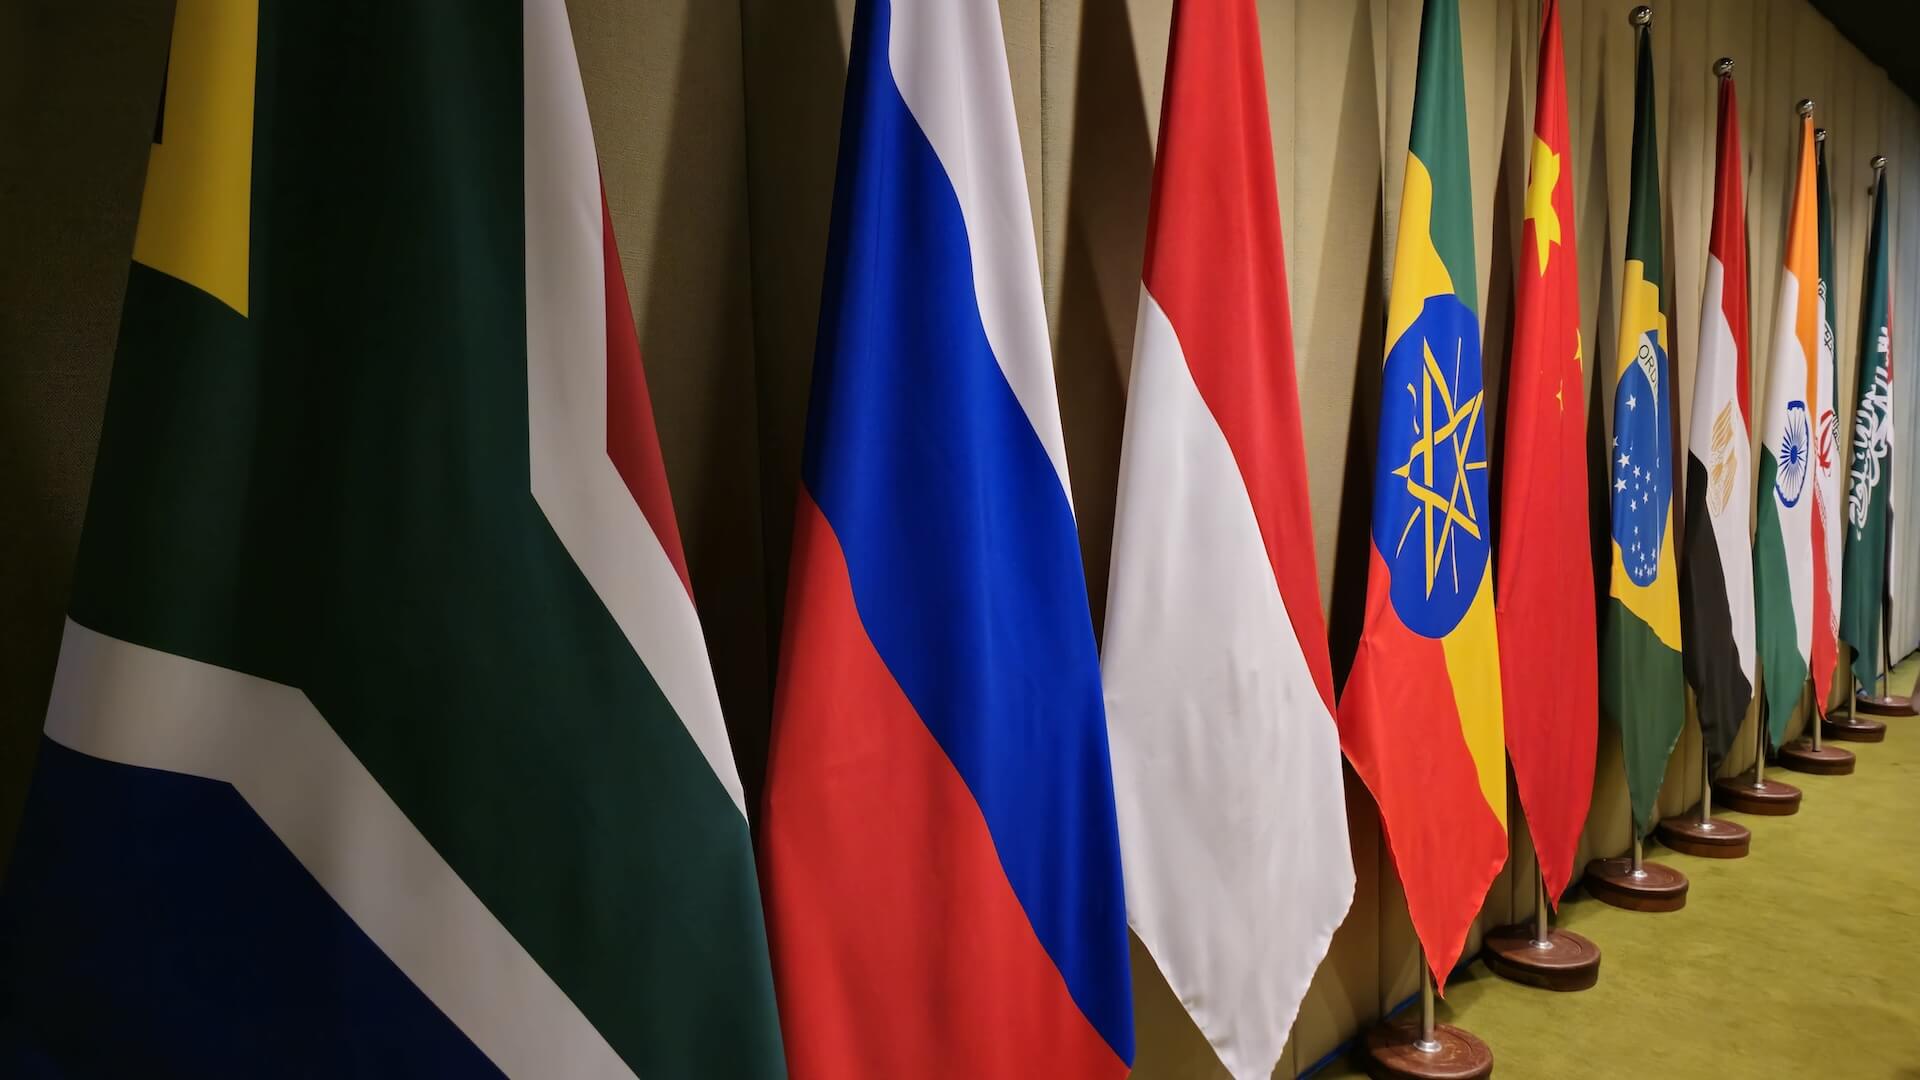
The BRICS+ bloc as of 2025 comprises 10 full members: the original five (Brazil, Russia, India, China, South Africa) plus Egypt, Ethiopia, Iran, Saudi Arabia, UAE (all joined January 2024), and Indonesia (joined January 2025). Approximately 30+ additional countries have formally applied for membership or expressed interest, including Algeria, Bolivia, Cuba, Kazakhstan, Nigeria, Pakistan, Senegal, Thailand, Turkey, Venezuela, and Zimbabwe. The expansion criteria remain informally defined — the bloc lacks the formal membership rules of the EU or WTO — but reflect a preference for nations with significant GDP, population, regional influence, or strategic resource holdings. Turkey's potential membership is particularly significant, as a NATO member considering alignment with BRICS+ would represent a major geopolitical rupture. The BRICS+ countries statistics collectively paint a picture of extraordinary diversity: from China's $19.5 trillion economy to Ethiopia's $0.2 trillion, from Russia's advanced nuclear arsenal to Ethiopia's predominantly agrarian economy, from Saudi Arabia's $32,000 per capita income to India's $2,750.
| Country | Joined | GDP (Nominal) | Growth 2025 | Population | GDP Per Capita |
|---|---|---|---|---|---|
| 🇨🇳 China | 2009 (founder) | $19.5T | +4.6% | 1.41B | $13,800 |
| 🇮🇳 India | 2009 (founder) | $4.0T | +6.5% | 1.44B | $2,750 |
| 🇧🇷 Brazil | 2009 (founder) | $2.5T | +2.2% | 215M | $11,600 |
| 🇷🇺 Russia | 2009 (founder) | $1.7T | +1.2% | 144M | $11,800 |
| 🇸🇦 Saudi Arabia | Jan 2024 | $1.2T | +2.8% | 36M | $32,000 |
| 🇦🇪 UAE | Jan 2024 | $0.55T | +4.2% | 10M | $50,000 |
| 🇮🇩 Indonesia | Jan 2025 | $1.5T | +5.1% | 278M | $5,400 |
| 🇮🇷 Iran | Jan 2024 | $0.4T | +3.2% | 87M | $4,600 |
| 🇪🇬 Egypt | Jan 2024 | $0.4T | +4.0% | 105M | $3,800 |
| 🇿🇦 South Africa | 2010 (founder) | $0.38T | +1.5% | 61M | $6,200 |
| 🇪🇹 Ethiopia | Jan 2024 | $0.2T | +7.5% | 130M | $1,050 |
BRICS+ Combined GDP Growth — 2000 to 2030*
The bar chart below tracks the combined nominal GDP of BRICS+ nations from 2000 to 2026 (actual) and projected through 2030. The trajectory is extraordinary: BRICS+ combined GDP grew from approximately $3.2 trillion in 2000 to $28.5 trillion in 2025 — a nearly 9x increase in 25 years, far outpacing the G7's growth over the same period. The 2009 dip (Global Financial Crisis) was shallower and shorter for BRICS than for advanced economies — China's massive fiscal stimulus and India's domestic consumption resilience provided a crucial global growth buffer. The BRICS+ countries statistics on GDP growth since 2000 represent one of the most dramatic economic transformations in recorded history, lifting hundreds of millions out of poverty while simultaneously building the world's second-largest economy (China), fourth-largest (India), and generating vast sovereign wealth funds in the Gulf member states.
BRICS+ GDP Growth Indexed — All Members Compared (Base Year 2010 = 100)
The indexed chart below shows each BRICS+ member's GDP growth trajectory relative to its own 2010 baseline — revealing which economies have grown fastest in relative terms. Ethiopia and India lead all BRICS+ members in indexed growth, while China's trajectory represents the most consequential absolute expansion. Russia's flat-to-declining index since 2022 reflects the severe economic sanctions following its Ukraine invasion. The chart directly mirrors the Bitcoin halving design — showing divergent performance cycles across different BRICS+ economies, with each "expansion wave" beginning at different times based on structural reforms, commodity cycles, and demographic tailwinds. This comparative indexed view of BRICS+ countries statistics is critical for understanding which member economies will drive the bloc's growth through 2030.
BRICS+ vs G7 — GDP, Trade, and Population by the Numbers
The most striking comparison in global economics is the convergence between BRICS+ and G7 economic weight. In purchasing power parity (PPP) terms — which adjusts for the fact that a dollar buys more in India or China than in the US — BRICS+ surpassed the G7 in 2023 for the first time, a symbolic milestone confirming the structural shift of economic gravity toward the developing world. The BRICS+ countries statistics on PPP-adjusted GDP reflect that workers in emerging economies are more productive in real terms than nominal exchange rates suggest, and that the domestic purchasing power of BRICS+ consumers is far larger than nominal GDP implies. This has profound implications for multinational corporations, which increasingly prioritize BRICS+ consumer markets for growth. The relationship between BRICS+ economic rise and the broader global economy's trajectory is inseparable — BRICS+ growth is the primary driver of world GDP expansion.
BRICS+ vs G7 — A Complete Comparative Analysis
The BRICS+ vs G7 comparison is the defining geopolitical and economic rivalry of the 21st century. In nominal GDP terms, the G7 ($46 trillion) still holds a commanding lead over BRICS+ ($28.5 trillion) — a 62% gap that reflects the massive per-capita income advantage of advanced economies. However, the growth gap is decisively in BRICS+ favor: BRICS+ economies are growing at an average of approximately 4.5% annually versus G7's 1.8%, meaning the nominal GDP gap is narrowing by approximately $1.5–2 trillion per year. On current trajectories, BRICS+ nominal GDP will approach G7 levels by approximately 2035–2038. Beyond GDP, the comparison reveals BRICS+ superiority in natural resources (oil, gas, minerals, agricultural land), population and labor force, and territorial extent — while the G7 leads in technology, financial infrastructure, military capability, institutional quality, and per-capita wealth. The BRICS+ countries statistics on military spending tell a nuanced story: China alone spends approximately $225 billion annually, Russia $85 billion, India $85 billion, and Saudi Arabia $75 billion — combined BRICS+ defense spending of approximately $520 billion approaches the G7 ex-US total.
BRICS+ Trade & Energy — Controlling the World's Resource Flows
BRICS+ countries' control over global natural resources and commodity flows represents their most powerful strategic lever in the world economy. In oil and gas — the most traded commodities on earth — BRICS+ dominance is striking: Russia (~10 mbd), Saudi Arabia (~9 mbd), UAE (~3.5 mbd), Iran (~3 mbd), and Brazil (~3.5 mbd) collectively produce approximately 44% of global crude oil output. Combined with OPEC+ coordination (which overlaps significantly with BRICS+ membership), this gives the bloc substantial influence over global oil prices — with direct implications for inflation, economic growth, and energy security in every importing nation. The mechanics of how this oil moves from production to consumption runs through the global oil and gas transportation networks — pipelines, tankers, and LNG terminals — where BRICS+ nations are both dominant producers and rapidly growing consumers.
On merchandise trade, China ($3.7T exports) is the world's largest exporter and the largest trading partner of approximately 130 countries globally. India's exports have grown from $300 billion in 2015 to approximately $780 billion in 2025, reflecting its emergence as a major manufacturing and services exporter. Brazil is the world's largest agricultural exporter (soybeans, beef, sugar, coffee), dominating food supply chains that feed Europe, China, and the Middle East. Russia, despite sanctions, continues to export approximately $350 billion annually in energy, metals, and agricultural commodities — primarily to BRICS+ partners. The global oil refinery industry is particularly relevant to BRICS+ economics — China has the world's largest refining capacity outside the US, and Saudi Arabia's ARAMCO is investing massively in downstream refining to capture more value from its oil exports.
Top BRICS+ Countries by Oil Production — 2025
BRICS+ Population — 3.6 Billion People and the Demographic Dividend
The demographic weight of BRICS+ countries is one of the most significant structural advantages of the bloc. With 3.6 billion people — 45% of humanity — BRICS+ nations encompass the world's two most populous countries (India at 1.44 billion, China at 1.41 billion), the world's fourth most populous (Indonesia at 278 million, now a BRICS+ member), and some of the world's fastest-growing populations (Ethiopia at 130 million and growing at 2.5% per year, Egypt at 105 million). The BRICS+ countries statistics on age structure reveal a crucial asymmetry: while China faces rapid aging (median age rising from 37 to 45 by 2040), India, Indonesia, Ethiopia, and Egypt have young, growing workforces that will fuel economic growth for decades. India's working-age population (15–64) will continue growing until approximately 2055 — providing a demographic dividend that China has already exhausted.
BRICS+ De-Dollarization — The Challenge to the US Dollar's Global Reserve Status

One of the most consequential — and contested — ambitions of the BRICS+ bloc is reducing dependence on the US dollar in international trade and financial transactions. The US dollar's reserve currency status, established at Bretton Woods in 1944, gives the United States extraordinary "exorbitant privilege": the ability to run persistent trade deficits, borrow cheaply in its own currency, and impose economic sanctions by cutting off access to the dollar system (as demonstrated against Russia in 2022). BRICS+ nations — particularly those subject to US sanctions (Russia, Iran) or concerned about future vulnerability (China) — are actively building alternatives. The New Development Bank (NDB), the BRICS+ multilateral development bank headquartered in Shanghai, has committed to disbursing 30% of its loans in local currencies by 2026, up from near-zero in 2020. Bilateral trade between India and Russia, China and Brazil, and intra-Gulf BRICS+ flows is increasingly settled in rupees, renminbi, reais, and dirhams rather than dollars. Energy pricing is the most symbolic frontier: Saudi Arabia's reported discussions about accepting renminbi for oil sales would represent a direct challenge to the petrodollar system that has underpinned dollar supremacy since 1973. Understanding how global gas and energy prices are denominated and settled is central to understanding the de-dollarization debate — if BRICS+ energy trade shifts to local currencies, the implications for dollar demand and US monetary policy are profound.
The de-dollarization trend within BRICS+ is real but slower than headlines suggest. The US dollar still accounts for approximately 88% of all global forex transactions (BIS 2025 Triennial Survey) and 58% of global foreign exchange reserves — numbers that reflect deep structural lock-ins. However, within BRICS+ bilateral trade, dollar usage has declined sharply: India-Russia trade is now predominantly in rupees and rubles; China-Russia trade overwhelmingly in renminbi; Gulf-China oil settlement discussions continue. The NDB has issued local currency bonds in renminbi, rupees, and rand. A full BRICS currency — requiring monetary policy coordination among 10+ economies with vastly different inflation rates and fiscal positions — remains a distant prospect. The more likely near-term scenario is a fragmented "multipolar currency" system where the dollar, euro, renminbi, and rupee each handle significant but non-dominant shares of global trade finance. This directly affects Middle East oil industry pricing and settlement, as Gulf BRICS+ members navigate between dollar-denominated OPEC conventions and renminbi-denominated Chinese demand.
Five Structural Trends Defining BRICS+ Through 2030
BRICS+ 2030 — $40+ Trillion GDP and the New World Economic Order
By 2030, BRICS+ combined nominal GDP is projected to reach approximately $40–42 trillion, representing an increase of approximately 40–47% from the 2025 level of $28.5 trillion. This growth will be driven primarily by India ($6T+ projected), Indonesia ($2.2T+), China ($23T+, though with moderated growth), and the Gulf states benefiting from energy revenues and diversification. In PPP terms, BRICS+ is projected to represent approximately 38–40% of world GDP by 2030 — a further widening of its lead over the G7's declining PPP share. The BRICS+ countries statistics on future growth indicate that by 2030, at least three BRICS+ nations (China, India, Indonesia) will rank among the world's five largest economies. The bloc's population will approach 3.8 billion as Indonesia's 278 million and Ethiopia's 140 million add demographic weight. The New Development Bank's loan portfolio is projected to reach $100 billion by 2030, and the BRICS+ payment system — if successfully deployed — could handle $2–3 trillion in annual transactions, meaningfully reducing dollar dependency in emerging market trade finance.
Frequently Asked Questions — BRICS+ Countries Statistics
BRICS+ in 2025 includes 10 full members: Brazil, Russia, India, China, South Africa (original 5), plus Egypt, Ethiopia, Iran, Saudi Arabia, UAE (joined Jan 2024), and Indonesia (joined Jan 2025). 30+ nations have applied for membership or observer status.
$28.5 trillion nominal GDP in 2025 (26% of world total). In PPP terms, approximately 35% of world GDP — surpassing the G7's 30% PPP share. Projected to reach $40–42T by 2030.
BRICS+ leads in PPP GDP (35% vs 30%), population (45% vs 10%), oil production (44% vs ~8%), and land area. G7 leads in nominal GDP ($46T vs $28.5T), technology, financial infrastructure, and per-capita income. BRICS+ nominal GDP may approach G7 levels by 2035–2038.
Approximately 3.6 billion people — 45% of the world's 8.2 billion population. India (1.44B) and China (1.41B) together account for over 2.8 billion. Indonesia (278M), Ethiopia (130M), Brazil (215M), and Egypt (105M) add major demographic weight.
No common currency yet exists. However, dollar usage in BRICS+ bilateral trade has fallen from ~100% to ~60% since 2022. The NDB now disburses 30% of loans in local currencies. A full BRICS currency remains years away due to monetary policy coordination challenges.
Among large economies, India leads at 6.5% GDP growth in 2025. Ethiopia leads all BRICS+ at ~7.5% but from a small base. Indonesia (5.1%), UAE (4.2%), and China (4.6%) are also among the fastest-growing BRICS+ members.
BRICS+ produces approximately 44% of global crude oil (~44 million barrels/day). Russia (~10 mbd), Saudi Arabia (~9 mbd), UAE (~3.5 mbd), Iran (~3 mbd), Brazil (~3.5 mbd). BRICS+ also holds ~60% of proven global oil reserves.
Primary: IMF — World Economic Outlook (October 2025)
Primary: World Bank — World Development Indicators 2025
Primary: WTO — World Trade Statistical Review 2025
Additional: IEA World Energy Outlook 2025 · OPEC Annual Statistical Bulletin 2025 · UNCTAD Trade Report · UN DESA World Population Prospects 2024 · Goldman Sachs "Dreaming with BRICs" & follow-up research · Standard Chartered Global Focus · New Development Bank Annual Report 2025 · BIS Triennial Central Bank Survey 2025
