The Global Oil and Gas Transportation Industry in 2026: Moving $7.7 Billion of Petroleum Every Day
The oil and gas transportation industry, commonly called the "midstream" sector, is the critical link between upstream production (explored in analysis of the $3.3 trillion global oil industry) and downstream refining and distribution (detailed in coverage of the 103.3 million bbl/d global refining industry).
Every barrel of the world's 103 million bbl/d of oil consumption must travel from wellhead to refinery to consumer. The average barrel of crude travels approximately 5,000–8,000 km from production to processing. Saudi Arabian crude destined for a Chinese refinery travels 9,500 km by VLCC tanker. Permian Basin crude travels 1,200 km by pipeline to Gulf Coast refineries.
The midstream industry generated approximately $180 billion in revenue in 2025, split roughly 40% pipelines, 35% maritime tanker shipping, 15% LNG shipping, and 10% rail, truck, and barge transport. This revenue is more stable than upstream oil production revenue because midstream companies typically earn fees based on volume transported rather than commodity price, providing investors with predictable cash flows and supporting the sector's well-deserved reputation as the "toll roads" of the energy industry.
The industry faces a defining transition moment. Oil pipeline throughput is projected to peak alongside oil demand (2028–2035), but natural gas pipelines and LNG shipping are growing rapidly. Many pipeline operators are exploring hydrogen transport, CO2 pipelines for carbon capture, and renewable fuel logistics as future revenue streams. The oil price dynamics that drive transportation volumes are explored in comprehensive analysis of global oil and gasoline prices.
The scale of infrastructure involved is staggering. If the world's 2.2 million km of oil and gas pipelines were laid end to end, they would stretch from Earth to the Moon and back nearly three times. The global tanker fleet, at 600 million deadweight tonnes, could carry the equivalent of 4.2 billion barrels of oil simultaneously, enough to supply the entire world for approximately 42 days. The 700+ LNG carriers, each cooled to temperatures colder than the surface of Mars, represent some of the most technologically sophisticated vessels ever built. This infrastructure, constructed over more than a century at a cumulative investment exceeding $5 trillion, is the circulatory system of the global industrial economy.
Global Oil and Gas Transportation Market Size — 2010 to 2030*
The bar chart tracks midstream industry revenue from 2010 to 2026 with projections to 2030. Revenue has grown from approximately $120 billion in 2010 to $180 billion in 2025, driven by rising oil and gas production volumes, LNG trade expansion, and infrastructure investment in emerging markets.
The 2020 dip ($135B) reflects COVID-19 demand destruction. The 2022–2023 spike ($190B) reflects elevated tanker rates during the Russia sanctions-driven rerouting of global oil trade flows. The 2030 projection of $200–220B reflects continued LNG growth offsetting gradual crude pipeline volume declines.
Global Pipeline Infrastructure: 2.2 Million Kilometers Connecting Wellheads to Markets
Pipelines are the safest, cheapest, and most efficient method of transporting large volumes of crude oil and natural gas over land. The global pipeline network spans approximately 2.2 million km, enough to circle the Earth 55 times. Approximately 55–60% of global crude oil and 100% of piped natural gas is transported through this network.
The United States operates the world's largest pipeline network at approximately 900,000 km (including 250,000 km of crude oil and refined product pipelines and 650,000 km of natural gas pipelines). This network has been built over 150 years and represents approximately $1.5 trillion in cumulative infrastructure investment.
Russia operates the second-largest network at approximately 280,000 km, dominated by Transneft (the world's largest pipeline company, operating 68,000 km of crude oil pipelines) and Gazprom's natural gas transmission system (175,000 km). The Druzhba Pipeline ("Friendship Pipeline"), built in the 1960s, stretches 4,000 km from Western Siberia to refineries in Germany, Poland, Czech Republic, Slovakia, and Hungary.
China's pipeline network has expanded dramatically from approximately 50,000 km in 2005 to 180,000 km in 2025, operated primarily by PipeChina (spun off from PetroChina in 2019 as a national pipeline champion). Key Chinese pipelines include the Central Asia-China gas pipeline (from Turkmenistan, 1,833 km), the Russia-China Power of Siberia gas pipeline (3,000 km, delivering 38 billion cubic meters/year), and the West-East Gas Pipeline system (8,704 km).
The Middle East's pipeline infrastructure is critical for bypassing maritime chokepoints. Saudi Aramco's East-West Pipeline (Petroline) can transport 5 million bbl/d of crude across 1,200 km from eastern oil fields to the Red Sea port of Yanbu, bypassing the Strait of Hormuz. The UAE's Habshan-Fujairah Pipeline (370 km, 1.5 million bbl/d capacity) provides a similar bypass from Abu Dhabi's fields to the Gulf of Oman. These bypass pipelines are strategic assets worth billions in insurance value. The Middle East's oil infrastructure is explored in analysis of the Middle Eastern petroleum industry.
Major Pipeline Construction Projects — 2024–2030
New pipeline construction continues despite the energy transition narrative. India's Paradip-Hyderabad product pipeline (1,212 km), Nigeria's AKK gas pipeline (614 km, connecting gas-rich south to gas-poor north), East African Crude Oil Pipeline (EACOP, 1,443 km from Uganda to Tanzania's coast), and Trans-Saharan Gas Pipeline (proposed 4,128 km from Nigeria to Algeria) represent active construction or advanced planning.
In North America, the Mountain Valley Pipeline (MVP, 515 km, completed 2024) and TC Energy's Coastal GasLink (670 km, serving Canada's LNG Canada export terminal) represent the latest major completions. The cancellation of the Keystone XL Pipeline (2021) and Atlantic Coast Pipeline (2020) illustrate the growing regulatory and political challenges facing new pipeline construction in developed markets.
Pipeline Economics: Costs, Tariffs, and Return on Investment
Pipeline construction is enormously capital-intensive. A new large-diameter crude oil pipeline (36–48 inch diameter) costs approximately $5–10 million per kilometer in flat terrain, rising to $15–30 million/km in mountainous, urban, or environmentally sensitive areas. A major cross-country pipeline like the Trans Mountain Expansion (1,150 km, completed 2024) cost CAD $34 billion, making it one of the most expensive infrastructure projects in Canadian history.
Pipeline operators earn revenue through tariff-based fee structures, typically charging $2–5 per barrel for crude oil transportation and $0.10–0.50 per MMBtu for natural gas. These tariffs are regulated by government agencies (FERC in the US, CER in Canada, Bundesnetzagentur in Germany) and typically provide returns on equity of 10–14% for regulated assets. The regulated return model provides stable, predictable cash flows that support the high dividend/distribution yields (5–8%) that attract income investors to midstream equities.
Pipeline operating costs are remarkably low compared to other transport modes. Moving crude oil by pipeline costs approximately $3–5 per barrel for 1,000 km, versus $8–15/bbl by rail and $1–3/bbl by tanker for equivalent distances. Pipeline operating expenses include: electricity for pumping stations (the largest single cost, approximately 40% of opex), corrosion monitoring and maintenance (25%), right-of-way fees and land access (15%), and regulatory compliance and integrity management (20%).
Pipeline integrity management is a critical operational priority. Operators use "smart pigs" (Pipeline Inspection Gauges, autonomous sensors that travel inside the pipeline) to detect corrosion, cracks, and wall thinning. Modern smart pigs equipped with magnetic flux leakage (MFL) and ultrasonic sensors can detect defects as small as 1mm in pipe wall thickness across thousands of kilometers. PHMSA (US) mandates integrity assessments every 5–7 years for pipelines in high-consequence areas (near populated areas, drinking water sources, or ecologically sensitive zones).
The Geopolitics of Pipelines: Nord Stream, Druzhba, and Energy Weaponization
Pipelines are inherently geopolitical assets because they create physical infrastructure dependencies between exporting and importing nations that are difficult to reverse. The Nord Stream 1 and 2 pipelines (Russia to Germany, 1,224 km each, combined 110 bcm/year capacity) exemplified this dynamic: Germany's dependence on Russian pipeline gas gave Moscow significant political leverage, which Russia exploited by reducing Nord Stream 1 flows in 2022 before the pipelines were sabotaged in September 2022 in an act of underwater destruction that remains under investigation.
The Druzhba Pipeline (Russia to Central Europe, 4,000 km, capacity approximately 1.2 million bbl/d of crude) continues to supply crude oil to Hungary, Czech Republic, and Slovakia under EU sanctions exemptions, reflecting these landlocked nations' inability to access alternative seaborne crude supply. The pipeline's continued operation demonstrates the decades-long lock-in effect of pipeline infrastructure.
In Asia, the Power of Siberia pipeline (Russia to China, 3,000 km, 38 bcm/year) represents Russia's strategic pivot to Asian gas markets following the loss of European customers. The planned Power of Siberia 2 (via Mongolia, 50 bcm/year) would further deepen Sino-Russian energy interdependence. China's strategy of diversifying pipeline imports from Russia, Central Asia (Turkmenistan), and Myanmar reduces dependence on any single supplier and on the Strait of Malacca maritime chokepoint.
Pipeline Network by Country — Top 15 Nations 2025
The following table presents the world's 15 largest pipeline networks by total length, including crude oil, natural gas, and refined product pipelines. The United States dominates with approximately 40% of the global total.
| Rank | Country | Total (km) | Crude Oil | Natural Gas | Key Operator |
|---|---|---|---|---|---|
| 1 | United States | ~900,000 | 250K | 650K | Enterprise, Kinder Morgan |
| 2 | Russia | ~280,000 | 68K | 175K | Transneft, Gazprom |
| 3 | China | ~180,000 | 35K | 120K | PipeChina |
| 4 | Canada | ~120,000 | 23K | 75K | TC Energy, Enbridge |
| 5 | Argentina | ~55,000 | 8K | 38K | TGS, TGN |
| 6 | Australia | ~50,000 | 4K | 42K | APA Group, Jemena |
| 7 | India | ~48,000 | 10K | 22K | GAIL, Indian Oil |
| 8 | Saudi Arabia | ~22,000 | 8K | 12K | Saudi Aramco |
| 9 | Germany | ~38,000 | 2.4K | 32K | Open Grid Europe |
| 10 | Brazil | ~25,000 | 5.5K | 15K | Petrobras, TAG |
| 11 | Iran | ~40,000 | 9K | 28K | NIGC, NIOC |
| 12 | Mexico | ~30,000 | 12K | 14K | Pemex, IEnova |
| 13 | UAE | ~15,000 | 4.5K | 8K | ADNOC |
| 14 | UK | ~28,000 | 1.5K | 25K | National Grid |
| 15 | Kazakhstan | ~20,000 | 5K | 12K | KazTransOil |
Global Oil Tanker Fleet: 6,200+ Vessels Moving 40 Million Barrels Per Day
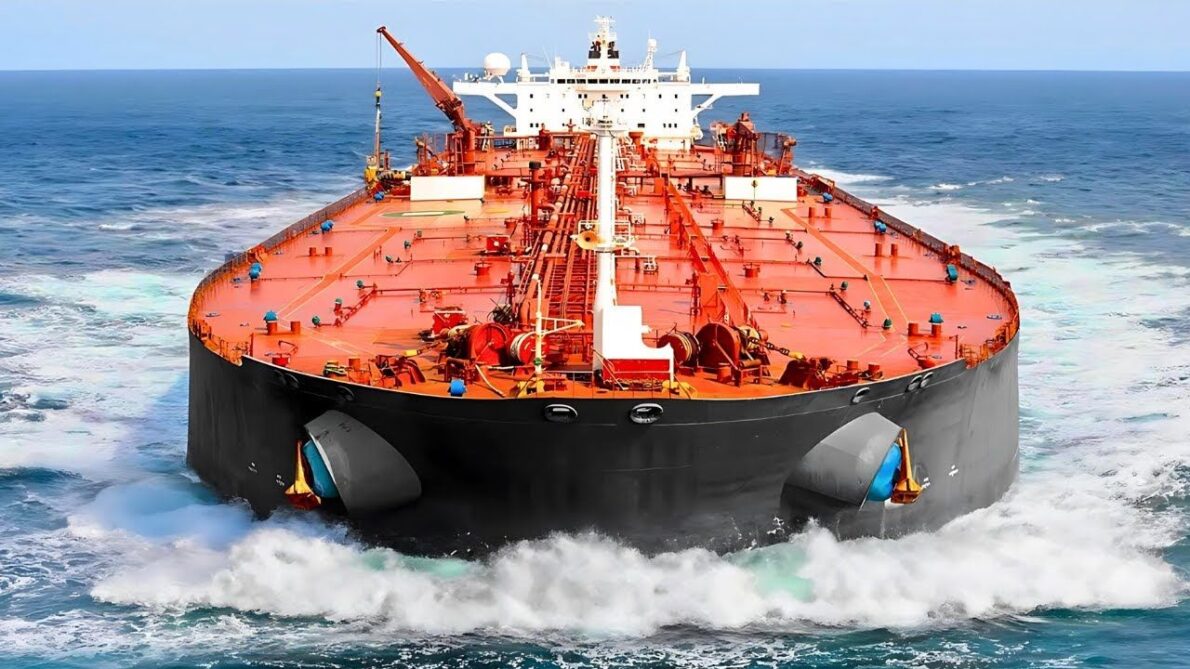
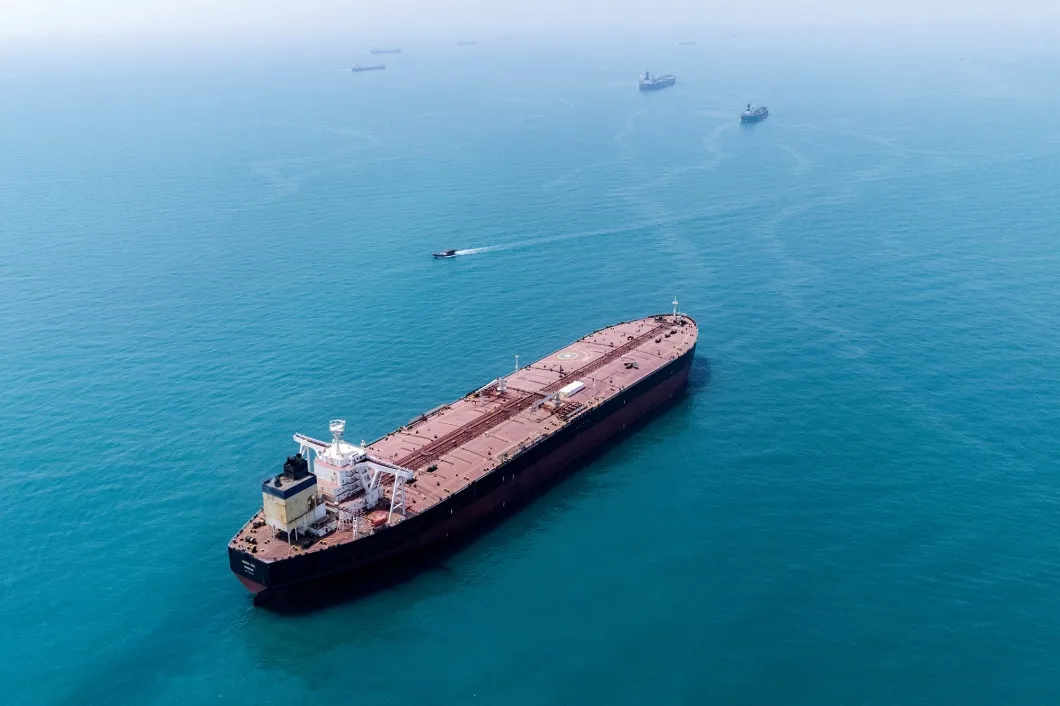
Maritime tanker shipping handles approximately 40% of global crude oil transportation (approximately 40 million bbl/d). The global tanker fleet consists of approximately 6,200 vessels with combined capacity of approximately 600 million deadweight tonnes (DWT).
Tankers are classified by size. VLCCs (Very Large Crude Carriers) are the workhorses of long-haul crude transport, carrying 2 million barrels per voyage. Approximately 900 VLCCs operate worldwide. A new VLCC costs approximately $120–130 million and earns approximately $30,000–80,000 per day depending on market conditions.
Suezmax tankers (600 vessels, 1 million barrel capacity) are sized to transit the Suez Canal fully loaded. Aframax tankers (700 vessels, 600,000 barrels) serve regional routes and smaller ports. Product tankers (4,000+ vessels) carry refined products like gasoline, diesel, and jet fuel from refineries to distribution terminals.
The tanker market experienced extraordinary rate volatility in 2022–2024. Russia sanctions forced the rerouting of approximately 3 million bbl/d of crude exports from short-haul European routes to long-haul Asian routes (Russia to India: 6,000 nautical miles vs. Russia to Rotterdam: 2,000). This tripled average voyage distances for Russian crude, absorbing available tanker capacity and pushing VLCC spot rates above $100,000/day in Q4 2022, versus a 10-year average of approximately $30,000/day.
The "shadow fleet" of approximately 600+ aging tankers has emerged to transport sanctioned Russian and Iranian crude outside Western insurance and regulatory frameworks. These vessels (typically 15–25 years old, lacking proper maintenance, and operating under opaque flag state registrations) represent a growing maritime safety and environmental risk. The P&I Club (marine insurance) industry estimates that shadow fleet vessels are responsible for a disproportionate share of oil spills and near-miss incidents.
Tanker Economics: Charter Rates, Voyage Economics, and Fleet Investment
The tanker industry operates on two primary commercial models: spot market (single-voyage charters, prices fluctuate daily) and time charter (long-term contracts, typically 1–5 years, providing stable revenue). In Q1 2026, VLCC spot rates average approximately $40,000–50,000/day, while 3-year time charter rates are approximately $35,000/day. A VLCC earning $45,000/day generates approximately $16.4 million in annual revenue, with operating costs of approximately $8,000–10,000/day covering crew, maintenance, insurance, and administration.
A typical VLCC voyage from the Persian Gulf to China (approximately 25 days one-way, 50 days round trip including loading and discharge) carries 2 million barrels of crude. At a spot rate of $45,000/day, the total freight cost is approximately $2.25 million, translating to approximately $1.12 per barrel, making tanker shipping remarkably cost-effective for intercontinental crude transport.
Fleet renewal is a constant challenge. The average age of the global tanker fleet is approximately 12 years, with approximately 15% of vessels over 20 years old (approaching the typical 25-year economic life). New vessel orders take 2–3 years for delivery from South Korean (Hyundai Heavy Industries, Samsung Heavy, Daewoo) and Chinese (CSSC, COSCO) shipyards. The current orderbook of approximately 250 tankers (including 50 VLCCs) represents approximately 4% of the existing fleet, considered moderate by historical standards.
IMO Regulations: Decarbonizing Maritime Oil Transport
The International Maritime Organization (IMO) has implemented several regulations that significantly impact tanker operations. The IMO 2020 sulfur cap (maximum 0.5% sulfur in marine fuel, down from 3.5%) forced tanker operators to either switch to expensive low-sulfur fuel oil (adding $5–8 million/year in fuel costs per VLCC) or install exhaust gas cleaning systems ("scrubbers") at $3–5 million per vessel.
The IMO's Carbon Intensity Indicator (CII) regulation (effective 2023) rates vessels A through E based on their carbon efficiency. Vessels rated D for three consecutive years or E for one year must submit corrective action plans. This effectively mandates slow steaming (reducing speed to cut fuel consumption) and fleet renewal, as older, less efficient tankers face operational restrictions. The IMO's long-term target of net-zero greenhouse gas emissions from shipping by 2050 will require adoption of alternative fuels (LNG, methanol, ammonia, hydrogen) for tanker propulsion.
Several tanker operators have ordered dual-fuel vessels capable of running on both conventional fuel oil and LNG, reducing CO2 emissions by approximately 20–25%. Maersk, CMA CGM, and Evergreen have pioneered methanol-fueled container ships, and the technology is expected to migrate to tankers by 2028–2030. Ammonia-fueled propulsion (producing zero carbon emissions) is in development but faces safety challenges due to ammonia's toxicity.
VLCC Tanker Rates vs. Oil Trade Volume — 2010 to 2026
The line chart tracks VLCC spot rates (gold line) and global seaborne oil trade volumes (blue line) from 2010 to 2026. The rate spikes in 2015 (OPEC price war increased Saudi exports), 2020 (floating storage demand during COVID), and 2022–2023 (Russia rerouting) are clearly visible.
LNG Shipping: 700+ Carriers Moving 420 Million Tonnes of Liquefied Natural Gas
The LNG shipping industry operates approximately 700+ specialized carriers that transport natural gas cooled to –162°C in liquid form. Global LNG trade reached approximately 420 million tonnes per annum (MTPA) in 2025, up from 240 MTPA in 2015, representing one of the fastest-growing segments in global energy logistics.
Qatar is the world's largest LNG exporter at approximately 106 MTPA, followed by Australia (approximately 82 MTPA) and the United States (approximately 95 MTPA, having grown from near-zero in 2015 to become the world's second-largest exporter). Qatar's North Field expansion project will add 48 MTPA of additional capacity by 2028, cementing Qatar's position as LNG king.
A modern Q-Max LNG carrier (the largest class, built for Qatar's fleet) costs approximately $250 million, carries 266,000 cubic meters of LNG, and can transport the equivalent of 3.4 billion cubic feet of natural gas per voyage. The global LNG carrier orderbook exceeds 200+ vessels on order as of Q1 2026, the largest in history, reflecting booming LNG demand from Europe (replacing Russian pipeline gas) and Asia.
The European energy crisis of 2022 dramatically accelerated LNG shipping demand. Europe's LNG imports surged from approximately 80 MTPA in 2021 to 130 MTPA in 2023 as the continent replaced Russian pipeline gas (which fell from 155 bcm/year to approximately 15 bcm/year). This structural demand shift has tightened the LNG carrier market, with spot charter rates reaching $300,000+/day in winter 2022–23, versus a pre-crisis average of $60,000–$80,000/day.
Major LNG Export Projects Under Construction — 2024–2030
The LNG industry has approximately 180 MTPA of new liquefaction capacity under construction globally as of Q1 2026, the largest wave of investment in LNG history. The major projects include:
Qatar's North Field Expansion: The world's largest LNG project, adding 48 MTPA in two phases (North Field East: 32 MTPA, North Field South: 16 MTPA), bringing Qatar's total LNG capacity from 77 to 126 MTPA by 2030. Total project cost: approximately $50 billion. QatarEnergy has secured long-term supply contracts with buyers in China, South Korea, Germany, Italy, and France.
US Gulf Coast projects: Golden Pass LNG (18 MTPA, Qatar/ExxonMobil JV, Texas), Plaquemines LNG (20 MTPA, Venture Global, Louisiana), Port Arthur LNG (13 MTPA, Sempra, Texas), and Rio Grande LNG (17 MTPA, NextDecade, Texas) will collectively add approximately 68 MTPA of US export capacity by 2028, cementing the US position as the world's largest or second-largest LNG exporter alongside Qatar.
Mozambique LNG (13.1 MTPA, TotalEnergies, delayed by insurgency) and Tanzania LNG (10 MTPA, Equinor/Shell, pre-FID) represent Africa's LNG potential. Canada's LNG Canada (14 MTPA, Shell-led consortium, British Columbia) achieved first LNG export in 2025, opening a new Pacific Basin LNG supply corridor.
LNG Trade Routes: Connecting Producers to Asian and European Consumers
LNG trade routes are organized into two primary basins. The Atlantic Basin connects US Gulf Coast and Trinidad & Tobago exports to European import terminals (Spain, France, UK, Netherlands, Germany, Poland, Italy). The Pacific Basin connects Australian, Qatari, Malaysian, Indonesian, and increasingly US (via Panama Canal) exports to Northeast Asian buyers (Japan, South Korea, China, Taiwan). Qatar's strategic mid-point location allows it to flexibly supply both basins depending on seasonal pricing differentials.
Japan remains the world's largest LNG importer at approximately 70 MTPA, despite declining volumes due to nuclear reactor restarts. China has grown from near-zero LNG imports in 2005 to approximately 72 MTPA in 2025, becoming the world's second-largest importer. South Korea (approximately 46 MTPA), India (approximately 28 MTPA), and Europe collectively (approximately 130 MTPA) round out the major import markets.
Critical Oil Transportation Chokepoints: Where Global Energy Flows Are Most Vulnerable
Global oil transportation relies on several narrow maritime passages ("chokepoints") where disruption could immediately constrain global supply and spike prices. Any blockage at these points has no short-term alternative, making them the most geopolitically sensitive locations in global energy security. The reserves that flow through these chokepoints are analyzed in coverage of the world's top oil reserve holders.
Oil Transportation Through Major Chokepoints — 2025
The Strait of Hormuz is the world's most critical energy chokepoint. At its narrowest point just 33 km wide, with only two 3-km shipping lanes, it handles 21 million bbl/d of crude oil (20% of global consumption) plus 25% of global LNG trade. Iran's military capability to temporarily close or disrupt Hormuz transit is the single most significant geopolitical risk to global oil markets.
The Bab el-Mandeb Strait (connecting the Red Sea to the Gulf of Aden) has become a live conflict zone since late 2023 due to Houthi rebel attacks on commercial shipping. Approximately 80+ commercial vessels have been attacked since November 2023, forcing approximately 15% of global trade to reroute around the Cape of Good Hope, adding 10–14 days and $1–2 million per voyage.
The Suez Canal (5.5 million bbl/d of oil transit) was blocked for six days in March 2021 when the container ship Ever Given ran aground, disrupting approximately $9.6 billion in daily trade. The incident demonstrated the vulnerability of this 193-km waterway that connects the Mediterranean to the Red Sea.
The Strait of Malacca (16 million bbl/d, connecting the Indian Ocean to the Pacific) is the primary route for Middle Eastern crude destined for China, Japan, and South Korea. China's "Malacca Dilemma" (dependence on a chokepoint outside Chinese naval control) drives Beijing's investment in overland pipeline alternatives (Myanmar-China pipeline) and strategic petroleum reserves.
Strategic Petroleum Reserves: Insurance Against Supply Disruption
Governments maintain Strategic Petroleum Reserves (SPRs) as insurance against supply disruptions at chokepoints and other crisis events. The US SPR, stored in underground salt caverns along the Gulf Coast, holds approximately 380 million barrels in Q1 2026 (down from a peak of 727 million barrels in 2009 following the Obama-era drawdown and Biden administration's 2022 emergency release of 180 million barrels to combat high gasoline prices).
China's SPR is estimated at approximately 950 million barrels (the world's second-largest, though China does not officially disclose SPR levels), sufficient for approximately 80 days of net import cover. Japan holds approximately 500 million barrels (government + private sector combined, approximately 200 days of net import cover). The IEA requires member nations to maintain at least 90 days of net import cover in strategic reserves, a requirement that has been tested during every major supply disruption since the 1970s.
The US SPR release of 2022 was the largest in history and demonstrated the reserve's effectiveness as a price management tool: the release of approximately 1 million bbl/d over six months (March–October 2022) contributed an estimated $0.35–$0.40/gallon reduction in US gasoline prices. However, the drawdown reduced the SPR to its lowest level since 1984, and replenishing the reserve at 2025–2026 prices ($70–80/bbl) will cost approximately $25–30 billion.
The Insurance and Financing Layer: How Oil Shipments Are Protected
Every oil shipment is backed by a complex web of insurance, letters of credit, and trade finance. Protection & Indemnity (P&I) Clubs (International Group of P&I Clubs, based in London) provide liability insurance for approximately 90% of the world's ocean-going tanker fleet, covering pollution liability, crew injury, cargo damage, and collision costs up to approximately $8 billion per incident through shared pooling arrangements.
Hull and machinery insurance covers the physical vessel, with a modern VLCC insured for approximately $80–100 million. Cargo insurance covers the oil being transported, with a fully laden VLCC carrying approximately $150 million worth of crude oil at $75/bbl. War risk insurance premiums have surged in the Red Sea/Bab el-Mandeb region since the Houthi attacks began in late 2023, adding $0.5–1.0% of hull value per transit (approximately $500,000–$1 million per voyage for a VLCC), a cost that is ultimately passed through to oil consumers via higher delivered crude prices.
The shadow fleet's lack of P&I insurance means that if a major spill occurs from a sanctioned tanker, there may be insufficient funds to cover cleanup costs (which can reach $1 billion+ for major incidents). This creates an "insurance gap" that ultimately falls on the government of the affected coastal state, representing a significant hidden liability of the sanctions regime.
Crude by Rail, Truck, and Barge: The Last-Mile Logistics of Oil Transportation
Crude-by-rail surged as a transportation mode in North America between 2011 and 2019 when pipeline capacity could not keep pace with shale production growth. US crude-by-rail volumes peaked at approximately 1.5 million bbl/d in 2014 before declining to approximately 300,000 bbl/d in 2025 as new pipeline capacity came online.
Rail transport costs approximately $8–15/bbl for long-haul routes (Bakken to East Coast), compared to $3–5/bbl by pipeline. The cost disadvantage means rail is used primarily when pipeline capacity is insufficient or unavailable. Canada's oil sands producers rely on approximately 200,000 bbl/d of rail transport due to the cancellation of Keystone XL and delays to Trans Mountain Expansion.
Tank trucks handle the "last mile" of petroleum distribution, moving refined products from storage terminals to retail gas stations. Approximately 300,000 petroleum tank trucks operate in the United States alone, making approximately 1.2 million deliveries per day to the nation's 145,000 gas stations. The connection between these supply chains and consumer fuel costs is explored in analysis of US energy price dynamics.
Barges transport approximately 500 million tonnes of petroleum products annually on inland waterways globally. The US inland waterway system (Mississippi River, Ohio River, Gulf Intracoastal Waterway) is the world's largest, moving approximately 650 million short tonnes of cargo annually, of which petroleum products represent approximately 30%.
Largest Midstream Oil and Gas Transportation Companies — 2026
The midstream sector is dominated by a mix of US Master Limited Partnerships (MLPs), national pipeline operators, and integrated oil company logistics divisions. US midstream companies trade on the NYSE as MLPs or C-corps and are popular with income investors due to their 5–8% distribution yields.
Enterprise Products Partners ($65B EV) is the largest US midstream company, operating 50,000+ miles of pipelines across the Gulf Coast, with particular strength in NGL (natural gas liquids) transportation and processing. It has increased distributions for 25+ consecutive years.
Transneft (Russia) is the world's largest pipeline company by volume, operating 68,000 km of crude oil pipelines that transport approximately 80% of Russia's crude production. Transneft is state-owned and handles approximately 9 million bbl/d of throughput.
PipeChina was established in 2019 by spinning off the pipeline assets of PetroChina, CNOOC, and Sinopec into a single national pipeline champion. It operates approximately 97,000 km of oil and gas pipelines across China and manages China's strategic petroleum reserve storage.
US Midstream Business Model: MLPs, Fee-Based Revenue, and Income Investing
The US midstream sector pioneered the Master Limited Partnership (MLP) business structure, which provides tax advantages (partnership income is taxed once at the unit holder level, avoiding corporate double taxation) in exchange for distributing the majority of cash flow to investors. MLPs like Enterprise Products, Energy Transfer, and MPLX generate 5–8% annual distribution yields, making them popular among income-focused investors, retirees, and pension funds.
The critical distinction between midstream and upstream economics is the fee-based revenue model. While an upstream oil producer's revenue rises and falls with crude oil prices, a midstream pipeline operator earns a fixed fee per barrel or per MMBtu transported, regardless of the commodity price. This means midstream revenues are driven by volume, not price. A pipeline operating at 90% utilization generates essentially the same revenue whether oil is $50/bbl or $100/bbl, providing remarkable earnings stability.
However, the fee-based model has limits. If oil demand declines (due to the energy transition) and pipeline volumes decrease, midstream revenues will decline regardless of oil prices. This long-term volume risk is why midstream companies are aggressively pursuing natural gas, NGL, and petrochemical transportation (which have longer demand runways than crude oil) and exploring hydrogen and CO2 transport as future growth verticals.
International Midstream Companies: State-Owned Giants
Outside the US, most major midstream infrastructure is operated by state-owned or state-controlled entities. Transneft (Russia) is the world's largest pipeline company by throughput, transporting approximately 80% of Russia's crude oil production through 68,000 km of pipelines. Transneft is 78% state-owned and operates as a natural monopoly, setting crude oil pipeline tariffs that are regulated by the Russian Federal Antimonopoly Service.
ADNOC Logistics & Services (UAE) was listed on the Abu Dhabi Securities Exchange in 2023 at a valuation of approximately $20 billion. It operates ADNOC's fleet of crude tankers, LNG carriers, and offshore support vessels, representing the UAE's strategy to capture downstream transportation value from its 4+ million bbl/d of oil production.
Saudi Aramco's pipeline division transports approximately 12 million bbl/d of crude oil and refined products through 22,000 km of pipelines within the Kingdom. In 2021, Aramco sold a 49% stake in its oil pipeline subsidiary to a consortium led by EIG Global Energy Partners for $12.4 billion, one of the largest infrastructure deals in Middle East history, demonstrating the enormous value embedded in midstream assets.
Transportation Safety: Pipeline Incidents, Tanker Spills, and Rail Accidents
The oil and gas transportation industry has significantly improved its safety record over the past three decades, though incidents still occur. US pipeline incidents have declined approximately 30% per mile since 2000 despite network expansion, with PHMSA reporting approximately 600 significant incidents annually (spills exceeding 5 gallons or causing injury/damage).
Major tanker oil spills have declined dramatically from an average of 24 per year in the 1970s to fewer than 2 per year in the 2020s. The largest spill in history, the Atlantic Empress (1979, 287,000 tonnes), dwarfs modern incidents. The Deepwater Horizon disaster (2010, approximately 4.9 million barrels) was a drilling platform blowout, not a transportation incident, but it reshaped industry safety culture.
The most significant transportation safety concern in 2026 is the shadow fleet of 600+ aging tankers transporting sanctioned crude. These vessels lack Western P&I insurance (limiting spill cleanup funding), operate with minimal regulatory oversight, and include vessels 20+ years old that major shipping companies have discarded. Environmental groups and the European Parliament have called for enhanced monitoring and potential restrictions on shadow fleet operations in European waters.
Crude-by-rail accidents peaked in 2013 when a runaway train carrying Bakken crude derailed and exploded in Lac-Mégantic, Quebec, killing 47 people and destroying the town center. This disaster led to comprehensive rail safety reforms including enhanced tank car standards (DOT-117 specification), electronically controlled braking, and speed restrictions in populated areas.
Pipeline Spill Statistics: Incidents Per Year and Remediation Costs
The US experienced approximately 600 significant pipeline incidents in 2024 (defined as spills exceeding 5 gallons or causing injury/property damage), releasing approximately 3.1 million gallons of petroleum products. While any spill is environmentally harmful, this represents a significant improvement from the 1990s when annual spill volumes were 3–5x higher despite a smaller pipeline network.
The largest recent US pipeline spill was the Keystone Pipeline leak in Washington County, Kansas (December 2022), which released approximately 14,000 barrels (588,000 gallons) of crude oil, making it one of the largest onshore oil spills in US history. TC Energy's cleanup costs exceeded $480 million. The Keystone incident reinforced public opposition to new pipeline construction and strengthened the regulatory hand of agencies demanding more frequent integrity assessments.
Environmental remediation for major pipeline spills costs $10,000–50,000 per barrel of oil spilled depending on terrain (water spills are 5–10x more expensive than land spills due to ecological damage and fisheries impact). Enbridge's 2010 Kalamazoo River spill (approximately 20,000 barrels) cost over $1.2 billion in cleanup and penalties, illustrating the catastrophic financial consequences of major incidents.
Maritime oil spill volumes have declined by over 99% since the 1970s despite tripling of seaborne oil trade. The adoption of double-hull tanker construction (mandated by the IMO after the Exxon Valdez disaster in 1989), improved vessel traffic management systems, GPS navigation, and better port state control inspections have dramatically reduced spill frequency and volume. In 2024, total global tanker spill volume was approximately 1,000 tonnes, compared to an average of 300,000 tonnes/year in the 1970s.
Energy Transition Impact: Pipelines Pivoting to Hydrogen, CO2, and Renewable Fuels
The energy transition presents the oil and gas transportation industry with both existential risk and transformative opportunity. If global oil demand peaks between 2028 and 2035 (as the IEA projects), crude oil pipeline throughput volumes will begin a structural decline, potentially stranding billions in infrastructure assets.
However, midstream companies are actively pivoting. Hydrogen transportation through repurposed natural gas pipelines is being tested in Europe (Germany's GET H2 initiative), the UK (HyNet North West), and the Netherlands (Hydrogen Backbone initiative). Studies indicate that existing natural gas pipelines can transport hydrogen blends of up to 20% with minimal modification, and dedicated hydrogen pipelines require $1–3 million/km of conversion investment.
CO2 pipeline networks for carbon capture and storage (CCS) represent another growth opportunity. The US 45Q tax credit ($85/tonne for geological sequestration) has made CO2 pipeline construction economically viable. Enterprise Products is developing a CO2 pipeline network in Texas, while Summit Carbon Solutions' proposed 3,200 km CO2 pipeline in the US Midwest would be the largest such project in the world.
LNG shipping is the brightest growth segment within oil and gas transportation, as natural gas serves as a transition fuel between coal and renewables. LNG trade is projected to grow from 420 MTPA in 2025 to 600+ MTPA by 2030, requiring 200+ additional carriers and billions in liquefaction, regasification, and terminal infrastructure investment.
The electric vehicle revolution is beginning to impact transportation fuel logistics, as documented in analysis of the global EV market's 17.5 million annual sales. As gasoline demand declines in developed markets, the pipeline and trucking networks that serve gasoline distribution will see reduced volumes, while diesel and jet fuel distribution may remain robust for longer.
Biofuel and Renewable Fuel Logistics: The New Transportation Challenge
The growth of biofuels (renewable diesel, biodiesel, ethanol, sustainable aviation fuel) creates new transportation logistics requirements. Unlike crude oil, which flows from concentrated production regions through trunk pipelines, biofuel feedstocks (used cooking oil, soybean oil, animal fats, corn) are geographically dispersed, requiring collection networks of trucks, rail cars, and smaller pipelines.
The US renewable diesel market has grown from near-zero in 2015 to approximately 150,000 bbl/d in 2025, creating demand for dedicated rail and pipeline transport from processing facilities to blending terminals. Several former crude oil refineries converted to renewable fuel production (Phillips 66 Rodeo, Marathon Dickinson) now receive feedstock by rail and truck rather than crude by pipeline, representing a fundamental shift in downstream logistics.
Sustainable Aviation Fuel (SAF) logistics present unique challenges. SAF must be blended with conventional jet fuel at airport fuel farms, requiring dedicated storage, testing, and quality control infrastructure at each airport. The EU's ReFuelEU mandate (2% SAF by 2025, rising to 70% by 2050) will require massive investment in SAF supply chains connecting production facilities to the world's 4,000+ commercial airports.
The ammonia as fuel supply chain is an emerging area of transportation infrastructure investment. If ammonia (NH3) gains traction as a zero-carbon shipping fuel (as advocated by Maersk, MAN Energy Solutions, and several Japanese shipping companies), global demand could reach 100–200 million tonnes annually by 2040, requiring a completely new transportation and storage infrastructure alongside existing petroleum logistics networks. Several Middle Eastern countries (Saudi Arabia through NEOM, UAE through ADNOC) are positioning themselves as major green ammonia exporters, leveraging their solar energy resources and existing port infrastructure.
Oil and Gas Transportation Industry — 2026 to 2030 Outlook
The midstream industry's trajectory through 2030 will be defined by the divergence between oil (plateauing) and gas/LNG (growing). Total industry revenue is projected to reach $200–220 billion by 2030, with growth driven entirely by LNG shipping, natural gas pipelines, and emerging CO2/hydrogen transport.
Crude oil pipeline throughput in the US is projected to plateau at 2025–2026 levels as shale production growth slows. European pipeline operators face declining volumes as the continent reduces oil and Russian gas imports. Middle Eastern and Asian pipeline networks will continue expanding to connect new production to demand centers.
The tanker market faces structural oversupply risk as approximately 200+ new vessels on order deliver between 2025 and 2028. However, the ongoing shadow fleet dynamic (aging sanctioned tankers absorbing capacity) and potential scrapping of pre-2000 vessels could tighten the market in the medium term.
Five Trends Shaping Oil and Gas Transportation Through 2030
Frequently Asked Questions — Oil and Gas Transportation
$180 billion annual revenue. 2.2M km pipelines, 6,200+ tankers, 700+ LNG carriers, 400K+ rail cars. Moves 100M+ bbl/d equivalent. Split: 40% pipeline, 35% tanker, 15% LNG, 10% rail/truck.
55–60% of global crude oil. 2.2M km network. US has 900K km (40% of global total). Key: Druzhba (Russia-EU, 4,000km), Petroline (Saudi, 1,200km), Keystone (Canada-US).
6,200+ vessels, 600M DWT capacity. Includes 900 VLCCs (2M bbl each), 600 Suezmax, 700 Aframax, 4,000+ product tankers. New VLCC: $120–130M. Day rates: $30K–$80K.
Strait of Hormuz (21M bbl/d), Malacca (16M), Bab el-Mandeb (6.2M), Suez Canal (5.5M), Turkish Straits (3M). Hormuz closure could push oil above $200/bbl.
700+ carriers, 420 MTPA global trade. Top exporters: Qatar (106MT), US (95MT), Australia (82MT). Q-Max carrier: $250M, 266K cbm. 200+ new vessels on order. Growing 8–10%/yr.
US: Enterprise Products ($65B), Energy Transfer ($55B), Williams ($50B), Kinder Morgan ($45B). Global: Transneft (Russia), PipeChina, ADNOC Logistics, Saudi Aramco pipelines.
Oil pipelines face peak volume risk (2028–2035). But: LNG shipping booming (420→600+ MTPA by 2030), hydrogen pipeline repurposing underway, CO2 pipeline networks for CCS growing. Gas pipelines expanding. Revenue: $180B→$200–220B by 2030.
Primary: U.S. EIA — Petroleum & Natural Gas Infrastructure Data
Primary: IEA — Oil Market Report, Gas Market Report, LNG Market Tracker
Primary: Clarksons Research · BIMCO · S&P Global Maritime · Baltic Exchange (Tanker Rates)
Additional: PHMSA Pipeline Safety Data · IGU World LNG Report 2026 · GIIGNL Annual Report · Shell LNG Outlook 2026 · IMO Maritime Safety Reports · Company Reports: Enterprise Products, Energy Transfer, Williams, Kinder Morgan, TC Energy, Enbridge, Transneft, PipeChina, ADNOC
