How Many Weddings Happen in the U.S. Per Year?
Approximately 2.1 million weddings take place in the United States each year, according to the CDC National Center for Health Statistics and The Wedding Report. That translates to roughly 5,750 weddings per day, about 4 every minute, every day of the year. The number collapsed to approximately 1.3 million in 2020 due to COVID-19 pandemic restrictions, the lowest annual count since World War II, before rebounding sharply in 2021 (2.0 million) and stabilizing near 2.1 million through 2025. The broader consumer spending context that drives wedding budgets is tracked in our retail and consumer spending analysis.
- 2020 COVID collapse: ~1.3 million weddings, lowest since 1945, industry lost ~$24B in revenue
- 2021 rebound: ~2.0 million weddings as rescheduled couples finally wed, creating a wedding boom
- 2022–2025: Normalized at ~2.1 to 2.2 million annually
- Peak wedding months: October (#1 since 2017), June (#2), September (#3), all in top 3 since 2000
- Saturday dominance: ~75% of weddings are on Saturdays; Sunday (~13%) second; weekday weddings growing for cost savings
- Venue shift: Non-traditional venues such as barns, vineyards, parks, and museums now account for ~40% of all weddings, overtaking hotel ballrooms
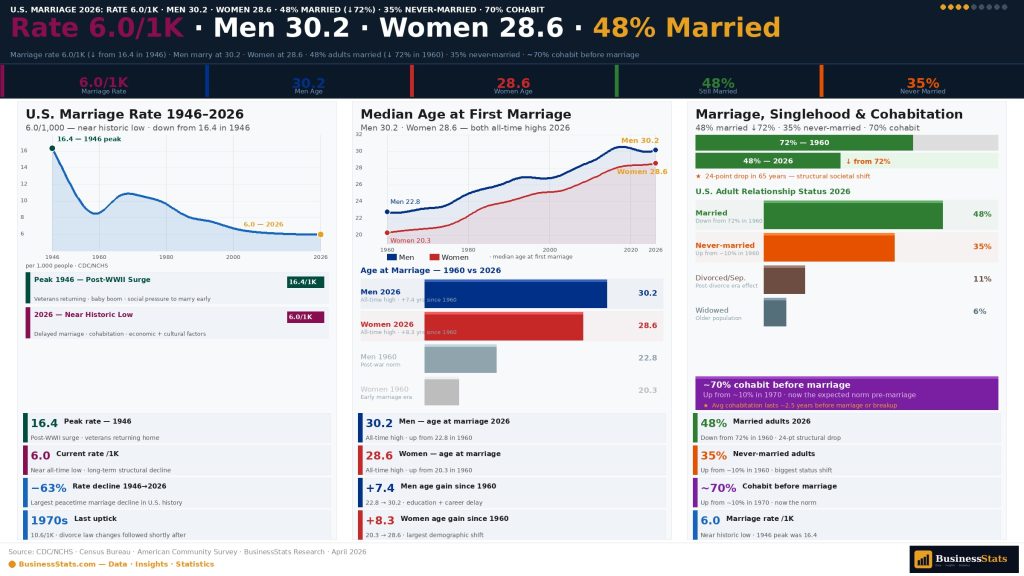
The long-term decline of the U.S. marriage rate is one of the most significant demographic trends of the past 80 years. From its post-WWII peak of 16.4 per 1,000 in 1946, when returning soldiers married in massive numbers, the rate has declined nearly every decade since. The steepest drop came in the 1970s, as women entered the workforce in unprecedented numbers, the birth control pill became widely accessible, and the sexual revolution changed courtship norms fundamentally. The rate stabilized somewhat in the 1980s–1990s before resuming its decline in the 2000s. Today's rate of approximately 6.0 per 1,000 is near the lowest in U.S. recorded history. This shift connects to broader changes in household formation and financial independence tracked in our U.S. wealth and demographics analysis.
Average Age at First Marriage — 30.2 for Men, 28.6 for Women
Americans have never married later than they do today. The median age at first marriage reached 30.2 years for men and 28.6 years for women in 2024, both all-time highs in U.S. recorded history. In 1960, the median age was 22.8 for men and 20.3 for women. This represents an extraordinary shift: Americans are now marrying approximately 7–8 years later than their grandparents did. The delay is driven by longer education, career establishment, housing costs, student debt, and the normalization of premarital cohabitation, all linked to broader lifestyle and consumer trends documented in our social media demographics and Instagram statistics.
- Men 2024: Median age 30.2 years at first marriage, up from 22.8 in 1960 (+7.4 years)
- Women 2024: Median age 28.6 years at first marriage, up from 20.3 in 1960 (+8.3 years)
- Never-married adults: ~35% of all U.S. adults have never married, up from ~10% in 1960
- College grads marry later: College-educated men marry at ~31 on average; women at ~29
- Regional variation: Utah lowest median age (~26); Massachusetts, New York highest (~32)
- Cohabitation first: ~70% of married couples now live together before marriage, up from ~10% in 1970
How Much Does a Wedding Cost in 2026?
The average cost of a U.S. wedding in 2025/26 is approximately $35,000 according to The Knot Real Weddings Study, making a wedding one of the largest single consumer expenditures most people will make in their lives, comparable to a car purchase or a year of college tuition. However, the median wedding cost is closer to $24,000, as the average is skewed upward by expensive urban weddings. Costs vary enormously by geography: a wedding in Manhattan averages over $55,000, while a similar celebration in rural Mississippi or Arkansas might cost $15,000–$18,000. The wedding industry's connection to luxury retail, Instagram-driven aspiration, and consumer credit is documented in our Instagram statistics and Amazon consumer data.
Average Wedding Cost by State — Highest vs Lowest 2025
| State | Avg Wedding Cost | Avg Guests | Cost/Guest | vs National Avg |
|---|---|---|---|---|
| New York / NYC | $55,000+ | 130 | $423+ | +57% |
| New Jersey | $51,000 | 147 | $347 | +46% |
| Hawaii | $49,000 | 95 | $516 | +40% |
| Connecticut | $47,000 | 135 | $348 | +34% |
| Massachusetts | $45,000 | 130 | $346 | +29% |
| California | $40,000 | 120 | $333 | +14% |
| Illinois | $38,000 | 140 | $271 | +9% |
| Florida | $34,000 | 130 | $262 | ~Avg |
| Texas | $30,000 | 140 | $214 | −14% |
| Georgia | $28,000 | 145 | $193 | −20% |
| Colorado | $27,000 | 110 | $245 | −23% |
| Tennessee | $24,000 | 140 | $171 | −31% |
| Ohio | $22,000 | 145 | $152 | −37% |
| Indiana | $20,000 | 145 | $138 | −43% |
| Mississippi | $16,000 | 145 | $110 | −54% |
| Arkansas | $15,000 | 140 | $107 | −57% |
One of the most dramatic shifts in the wedding industry over the past 5 years has been the rise of lab-grown diamonds. By 2025, lab-grown diamonds account for approximately 50% of all engagement ring center stones sold in the United States, up from less than 5% in 2018. Lab-grown diamonds are chemically and physically identical to mined diamonds, the only difference is origin, and cost approximately 50–80% less. The average engagement ring cost has actually declined in real terms over the past 3 years due to this shift. The traditional diamond industry, led by De Beers (which created the "two months' salary" guideline in 1939 as a marketing campaign) has responded by emphasizing the "rarity" and "natural origin" of mined stones. The luxury goods market transformation is tracked in our global company valuations report.
U.S. Divorce Rate — 2.4 per 1,000, and Declining
The U.S. divorce rate in 2024 is approximately 2.4 per 1,000 population : less than half of its 1980 peak of 5.3 per 1,000. The oft-quoted "50% of marriages end in divorce" is a misleading statistic that has never been accurate for any single cohort of marriages. The actual lifetime divorce probability for recent marriages is approximately 39–43% and declining. Divorce rates have been falling for over 40 years as marriage is increasingly delayed until partners are older, more financially stable, and have cohabited, which filters out less compatible couples. The economic consequences of divorce, a major driver of wealth inequality, are covered in our U.S. wealth statistics and financial markets analysis.
- Divorce rate 2024: 2.4 per 1,000 population, down from 5.3 (1980 peak), 4.0 (2000), 3.2 (2010)
- Actual lifetime probability: ~39–43% for recent marriages, not the "50%" commonly cited
- By education: College graduates ~28% lifetime divorce rate vs ~46% for those without high school diploma
- By age at marriage: Marrying after 25 reduces divorce risk by ~24%; after 30 reduces it further
- Gray divorce (50+): Growing, rate among 50+ adults has doubled since 1990 while younger couples' divorce rates fall
- First vs second marriage: First marriages: ~41% lifetime divorce rate; second marriages: ~60%; third: ~73%
The $70–75 Billion U.S. Wedding Industry
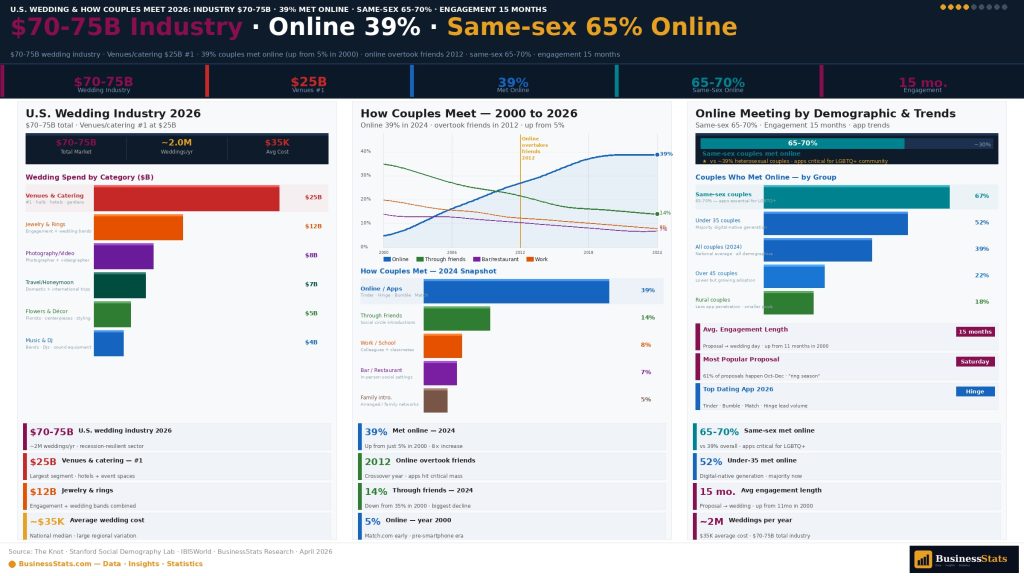
The U.S. wedding industry generates approximately $70–75 billion in annual revenue, making it one of the largest consumer event markets in the country. The global wedding services market is approximately $300 billion. The industry encompasses venues, catering, jewelry, photography, apparel, flowers, music, planning services, honeymoon travel, and an expanding universe of wedding-adjacent products and services from wedding registries to custom monogrammed gifts. After the COVID-19 collapse of 2020 (industry revenue fell approximately $24 billion), the 2021 recovery and subsequent demand surge pushed revenues to new highs. The industry's connection to luxury retail, travel, and consumer electronics (cameras, smart devices for wedding guests) creates broad economic ripple effects analyzed in our retail market analysis and global company valuations.
- Venues and catering (~$25B): Largest single segment · average venue+catering cost ~$13,500 (38% of budget) · hotels, barns, vineyards, estates
- Jewelry (~$12B): Engagement rings avg $6,000–$7,000 · wedding bands avg $1,200 (his), $900 (hers) · lab-grown diamonds reshaping pricing
- Photography/Videography (~$8B): Average photographer cost ~$2,900 · video ~$2,200 · most couples say #1 thing they'd spend more on
- Apparel (~$7B): Wedding dress avg $2,000 · bridesmaids avg $140/dress · suits/tuxedos avg $280
- Florals/Decor (~$5B): Average floral spend ~$2,800 · silk/artificial flowers growing share
- Music/Entertainment (~$4B): DJ avg $1,800 · live band avg $4,200 · photobooth avg $1,200
- Wedding planning (~$3B): Full-service planners avg $3,500–$5,000 · day-of coordinators avg $1,500
How Do Couples Meet? Online Dating Now the #1 Way
Online dating is now the #1 way couples meet in the United States, a transformation that happened within a single decade. Approximately 39% of couples who married in 2024 met through dating apps or websites, according to Stanford sociologist Michael Rosenfeld's ongoing research. This is up from approximately 22% in 2012 (the year Tinder launched). Meeting through friends (22%) is now second, followed by work or school (19%). Among same-sex couples, approximately 65–70% met online, making digital meeting nearly universal in that community. The social media and digital platform landscape that facilitates these connections is analyzed in our social media statistics, Instagram report, and YouTube analysis.
- Online dating 2024: ~39% of new marriages met online · up from ~22% (2012) · ~5% (2000) · ~1% (1995)
- Most popular dating apps: Tinder (~50M users) · Bumble (~42M) · Hinge (~23M) · Match.com (~15M)
- Same-sex couples: ~65–70% met online · digital meeting normalized earlier due to smaller dating pool in physical spaces
- Average Tinder user: ~90 minutes/day on app · avg 1.5 billion swipes/day globally · low % lead to marriage
- Marriage quality: Couples who met online report equal or higher relationship satisfaction vs those who met offline (multiple studies)
- Engagement timeline: Average engagement length is approximately 15 months before wedding date
Weddings and Marriage — Key Statistics & Facts 2026
Frequently Asked Questions — Weddings & Marriage 2026
Approximately 2.1 million weddings take place in the United States each year as of 2025/26 (CDC NCHS, The Wedding Report). That is approximately 5,750 weddings per day, or about 4 every minute. The count collapsed to approximately 1.3 million in 2020 due to COVID-19, the lowest since WWII, before rebounding sharply in 2021 (~2.0 million) and stabilizing at ~2.1 million. October is now the most popular wedding month; Saturday accounts for ~75% of all weddings.
The average cost of a U.S. wedding in 2025/26 is approximately $35,000 (The Knot Real Weddings Study). The median is closer to $24,000, the average is skewed by expensive urban weddings. Costs vary enormously: NYC weddings average $55,000+, while Mississippi and Arkansas average $15,000–$16,000. The biggest spend is venue and catering (~38% of budget, ~$13,500), followed by photography (~$2,900), florals (~$2,800), music (~$1,800), and apparel. The average engagement ring cost is $6,000–$7,000.
The U.S. marriage rate in 2024/25 is approximately 6.0 marriages per 1,000 population, near historic lows. It peaked at 16.4 in 1946 (post-WWII) and has declined since the 1970s: 11.0 (1970), 8.2 (2000), 7.0 (2010), 6.0 (2024). The long-term decline reflects later marriage age, higher cohabitation rates, more adults choosing to remain single, and changing social norms. About 48% of U.S. adults are currently married, down from 72% in 1960.
The median age at first marriage in the U.S. is 30.2 years for men and 28.6 years for women in 2024, both all-time highs. In 1960, the figures were 22.8 (men) and 20.3 (women). Americans are now marrying approximately 7–8 years later than in 1960, driven by longer education, career establishment, housing costs, student debt, and the normalization of premarital cohabitation (~70% of married couples now live together first). Utah has the lowest median marriage age (~26); Massachusetts and New York the highest (~32).
The U.S. divorce rate in 2024 is approximately 2.4 divorces per 1,000 population, less than half its 1980 peak of 5.3. The oft-cited "50% of marriages end in divorce" is misleading, the actual lifetime divorce probability for recent marriages is approximately 39–43% and declining. Divorce is less common now because marriages are later (older people are more stable partners), more selective (cohabitation filters some), and increasingly concentrated among college-educated higher earners. Gray divorce (ages 50+) is the one growing segment, it has doubled since 1990.
The U.S. wedding industry generates approximately $70–75 billion in annual revenue, one of the largest consumer event markets. The global wedding services market is approximately $300 billion. Key segments: venues and catering (~$25B), jewelry including engagement rings (~$12B), photography/videography (~$8B), apparel (~$7B), florals/décor (~$5B), music/entertainment (~$4B), and planning services (~$3B). The industry lost approximately $24 billion in 2020 (COVID) and fully recovered by 2022.
Approximately 48% of U.S. adults (18+) are currently married in 2024 (U.S. Census Bureau ACS), down from 72% in 1960, a 24-percentage-point decline in 64 years. Among adults aged 35–44, approximately 60% are married. About 35% of adults have never married (up from ~10% in 1960). Approximately 12% are divorced; 5% widowed. The share of never-married adults has grown most sharply among men without a college degree, reflecting declining economic prospects and changing social incentives for marriage.
October has become the most popular wedding month in the U.S. since approximately 2017, accounting for approximately 12% of annual weddings. June (#2) and September (#3) follow closely. Peak wedding season runs May through October. Saturday is by far the most popular wedding day (~75% of all weddings). The least popular months are January, February, and March, accounting for fewer than 15% of annual weddings combined. The traditional "June bride" remains culturally resonant but has given way to the fall foliage season.
Online dating is now the #1 way couples meet in the U.S., approximately 39% of couples who married in 2024 met online (Stanford Social Demography Lab). This is up from ~22% in 2012 (when Tinder launched) and ~5% in 2000. The second most common way is through friends (~22%), followed by work/school (~19%), bars/restaurants (~8%), religious organizations (~4%), and other (~8%). Among same-sex couples, approximately 65–70% met online. The shift has accelerated since COVID, people met fewer people in person during lockdowns and pivoted to apps.
The commonly cited "50% of marriages end in divorce" was never accurate for any single cohort, and is increasingly outdated. The actual lifetime divorce probability for recent U.S. marriages is approximately 39–43% and declining. The divorce rate peaked in the early 1980s and has fallen every decade since. Key factors that reduce divorce risk: marrying after age 25 (~24% risk reduction), having a college degree (~13% reduction), higher household income (significant protection), and not marrying impulsively. Second marriages divorce at ~60%; third at ~73%.
The average engagement ring cost in the U.S. is approximately $6,000–$7,000 in 2025 (The Knot), though the median is closer to $3,500–$4,500. Lab-grown diamonds, which are chemically identical to mined diamonds, now account for approximately 50% of engagement ring center stones and cost 50–80% less than natural equivalents. The "two months' salary" guideline was created by De Beers in 1939 as a marketing campaign; most financial advisors recommend spending 1–2 weeks' gross income. Wedding bands average approximately $1,200 (groom) and $900 (bride).
Top wedding trends in 2026: (1) Micro-weddings, under 50 guests now ~25% of all weddings (up from ~5% pre-COVID); (2) Lab-grown diamonds, 50%+ of engagement ring market; (3) Destination weddings and elopements, growing 20%+ annually; (4) Non-traditional venues, barns, vineyards, parks, museums (~40% of weddings); (5) AI-assisted planning, couples using AI for vendor research and coordination; (6) Dry/sober weddings, growing niche, particularly among Gen Z; (7) Personalized ceremonies over traditional religious formats; (8) Friday and Sunday weddings for cost savings.
Education is one of the strongest predictors of marriage stability. Estimated lifetime divorce rates by education (women): No high school diploma: ~46%; high school diploma: ~38%; some college: ~37%; bachelor's degree or higher: ~28%. The education gap in marriage stability has widened over time. College-educated Americans are increasingly likely to form stable, lasting marriages, a pattern sociologists call the "marriage divide." This reflects both economic stability (higher earners have fewer financial stressors) and selection effects (more deliberate partner choice among highly educated).
Approximately 19% of new U.S. marriages in 2024 are interracial or interethnic, up from 3% in 1967 (when anti-miscegenation laws were struck down in Loving v. Virginia) and 5% in 1980. Rates by group: approximately 29% of Asian Americans married outside their racial group; 26% of Hispanic Americans; 20% of Black Americans; 11% of White Americans. Hawaii, Nevada, and Oklahoma have the highest interracial marriage rates. Mississippi and Alabama have the lowest. Interracial marriage approval among Americans is at an all-time high of ~94% (Gallup 2024).
COVID-19 had the most dramatic short-term impact on the U.S. wedding industry in modern history. In 2020, U.S. weddings collapsed to approximately 1.3 million, the lowest since WWII, as gatherings were restricted or banned. The industry lost approximately $24 billion in revenue in 2020. The 2021 rebound was sharp: approximately 2.0 million weddings as couples rescheduled. By 2022–2025, demand normalized at ~2.1 million. COVID permanently changed wedding culture: micro-weddings grew from ~5% to ~25% of all weddings; outdoor and non-traditional venues gained popularity; and digital meeting (already growing) accelerated further as people met partners online during lockdowns.
