Global Conversion Rate Benchmarks 2026 — What the Data Really Shows
Conversion rate — the percentage of website visitors who complete a desired action such as a purchase, sign-up, or form submission — is one of the most critical metrics in digital commerce. The global average e-commerce conversion rate in 2026 is approximately 2.86%, meaning fewer than 3 in every 100 visitors to a typical online store actually make a purchase. This figure has remained remarkably stable over five years despite massive shifts in consumer behaviour — the rise of mobile-first browsing, social commerce via TikTok Shop and Instagram Shopping, and AI-powered personalisation have changed how people discover products, but have not dramatically moved the global average CVR.
However, the 2.86% global average is misleading in isolation. Conversion rates vary by as much as 5x between best-performing and worst-performing industry verticals. Food and grocery delivery achieves 5.5–7%+ because consumers have high purchase intent, habitual buying patterns, and subscription models that drive repeat visits. Consumer electronics averages just 1.4% because purchase decisions are high-value, heavily researched, and often completed offline or after comparing prices across multiple platforms. Understanding your specific vertical benchmark — not just the global average — is essential for setting realistic optimisation targets. For the broader digital commerce landscape see our Amazon statistics and Alibaba statistics.

Conversion Rates by Industry Vertical 2026 — 12 Sector Benchmark Chart
The chart below shows average e-commerce conversion rates across 12 industry verticals in 2026, ranked from highest to lowest. Food and grocery leads — driven by subscription models and habitual weekly ordering patterns. Arts and crafts performs surprisingly well due to passionate niche audiences with strong purchase intent and relatively low price points that reduce purchase friction. Consumer electronics lags due to high average order values, complex product comparisons, and a high share of research-only traffic from visitors who browse but intend to purchase via price comparison sites or physical stores.
Conversion Rate Benchmarks — Complete Data Table 2026
| Industry Vertical | Avg CVR | Top 25% | Top 10% | vs Global Avg | Rating |
|---|---|---|---|---|---|
| Food & Grocery | 7.0% | 10%+ | 18%+ | +4.14pp | Excellent |
| Arts & Crafts | 4.9% | 7.5% | 14% | +2.04pp | Excellent |
| Financial Services | 5.5%* | 9.0% | 14% | +2.64pp | Excellent |
| Pet Supplies | 3.6% | 5.8% | 10.5% | +0.74pp | Above Avg |
| Health & Beauty | 3.3% | 5.5% | 10% | +0.44pp | Above Avg |
| Home & Garden | 3.2% | 5.2% | 9.5% | +0.34pp | Above Avg |
| Sporting Goods | 2.6% | 4.4% | 8.0% | -0.26pp | Average |
| Fashion & Apparel | 2.2% | 4.0% | 8.5% | -0.66pp | Average |
| SaaS / Software | 2.2% | 3.8% | 7.0% | -0.66pp | Average |
| Travel | 1.8% | 3.5% | 6.5% | -1.06pp | Below Avg |
| Automotive | 1.8%* | 3.2% | 6.0% | -1.06pp | Below Avg |
| Consumer Electronics | 1.4% | 2.8% | 5.5% | -1.46pp | Below Avg |
*Financial Services = lead/quote CVR. Automotive = enquiry CVR. All others = purchase CVR.
Desktop vs Mobile Conversion Rates 2026 — The Persistent Gap
Mobile devices account for approximately 72% of global e-commerce traffic in 2026, yet mobile conversion rates average just 1.82% compared to 4.14% for desktop. Despite generating three-quarters of all traffic, mobile accounts for only 49% of e-commerce revenue. The gap has been narrowing — mobile CVR has improved approximately 35% over three years — but friction remains: smaller screens, touchscreen keyboard input for payment details, and consumer habits of browsing on mobile then purchasing on desktop all persist. One-click checkout solutions (Shop Pay, Apple Pay, Google Pay) are the single biggest lever reducing this gap — sites with one-click mobile checkout achieve 3.2–4.0% mobile CVR, nearly matching desktop.
Conversion Rates by Region — UK Leads, Southeast Asia Lags
E-commerce conversion rates vary significantly by geography — reflecting differences in digital maturity, payment infrastructure, consumer trust, logistics quality, and mobile penetration. The UK leads global conversion rates at approximately 4.2%, benefiting from decades of e-commerce adoption, high consumer trust in online payments, and world-class fulfilment networks. Germany is close at 4.0%. The US averages approximately 3.1%. Asia-Pacific shows divergence — Japan at 3.5% outperforms the US due to extremely low cart abandonment and high purchase intent per visit, while Southeast Asian markets like Indonesia and Vietnam average just 1.2–1.8% due to COD dominance and limited payment infrastructure. For broader regional economic context see our UK financial markets and Germany financial markets data.
Conversion Rate by Traffic Source — Email Dominates
Email marketing is the highest-converting traffic channel at approximately 5.3% — subscribers have opted in, have a brand relationship, and email campaigns target users at specific purchase cycle stages. Direct traffic converts at approximately 3.9% — loyal customers who type the URL directly or use bookmarks. Paid search converts at approximately 2.9% — visitors have intent, but keyword quality varies (brand terms convert at 8%+, generic category terms at 1–2%). Organic search averages 2.4%. Social media converts at just 0.9% — primarily discovery-oriented traffic. Paid social (Facebook/Instagram ads) performs better at 1.8% due to audience targeting. For advertising and digital market context see our Google statistics and Alphabet revenue data.
Conversion Rate Trends 2022–2026 — AI Personalisation Widens the Gap
The chart below tracks average e-commerce conversion rates from 2022 to 2026 across global average, mobile, desktop, and AI-personalised site experiences. The most significant trend is the growing performance gap between AI-personalised sites and the industry average. Sites using advanced AI recommendation engines (Adobe Sensei, Salesforce Einstein, Dynamic Yield, Nosto) consistently achieve conversion rates 1.5–2.5x higher than industry benchmarks. In 2022, AI personalisation was available mainly to large enterprise retailers. By 2026, mid-market platforms have democratised access — compressing the gap between elite and mid-tier performers. Mobile CVR growth of +35% over three years is the second major trend, driven by one-click checkout adoption.
Checkout Conversion Statistics 2026 — Where Sales Are Lost
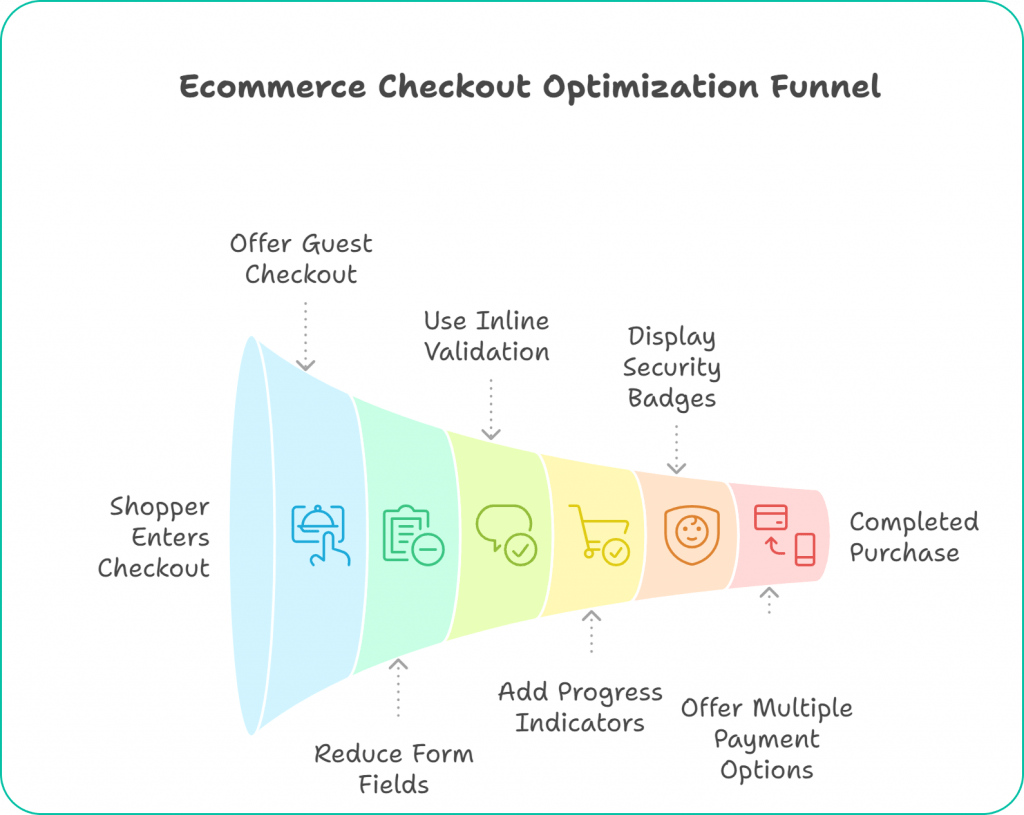
The checkout process is where the majority of e-commerce revenue is won or lost. Globally, the average cart abandonment rate stands at 70.19% in 2026 — meaning that for every 10 shoppers who add an item to their cart, approximately 7 leave without completing the purchase. On mobile devices, this figure rises to 85%. The primary reasons for cart abandonment are well-documented and remarkably consistent across markets: unexpected shipping costs at checkout (cited by 48% of abandoners), being forced to create an account before purchasing (24%), a checkout process perceived as too long or complicated (22%), inability to see the total order cost upfront (21%), and concerns about payment security (18%). Addressing these friction points is the single highest-ROI activity in e-commerce optimisation.
Checkout step reduction has a dramatic and measurable impact on conversion rates. The average e-commerce checkout process has 5.1 steps. Reducing to 2–3 steps can increase CVR by 20–35%. Guest checkout — allowing purchase without account creation — typically increases conversion rates by 15–45% for first-time visitors. The average checkout form still contains 14.88 fields globally; optimised checkouts use 7–8 fields. Each additional unnecessary field reduces completion rates by approximately 3–5%. Autofill compatibility is another major lever — sites that are fully autofill-compatible see 30% higher form completion rates on mobile devices where typing is most friction-prone. For context on financial transactions and payment infrastructure see our US financial markets statistics.
One-Click Checkout — The Single Biggest Mobile CVR Driver
One-click checkout solutions — Apple Pay, Google Pay, Shop Pay (Shopify), PayPal One Touch — represent the most impactful single intervention for mobile conversion rates. Sites that implement one-click checkout achieve mobile conversion rates of 3.2–4.0%, nearly matching desktop rates, compared to the 1.82% average for sites using traditional multi-field checkout forms. Shop Pay in particular shows an extraordinary impact: Shopify data shows Shop Pay achieves a checkout-to-order conversion rate of 1.72x higher than standard checkout. Apple Pay and Google Pay reduce checkout time from an average of 4 minutes 12 seconds (traditional) to under 30 seconds. The adoption of biometric authentication (Face ID, fingerprint) has eliminated the password-entry friction that previously made mobile purchasing particularly cumbersome. By 2026, approximately 45% of all e-commerce transactions globally are completed via digital wallets or one-click solutions, up from 28% in 2022.
Page Speed and UX Impact on Conversion Rates — The Data
Page speed is one of the most powerful and most consistently underestimated drivers of e-commerce conversion rates. A 1-second delay in page load time reduces conversion rates by 20% on mobile devices. A site that loads in 1 second converts 3x better than a site that loads in 5 seconds. Google's Core Web Vitals data for 2025 shows that the top-converting e-commerce sites load in under 2.5 seconds on mobile (Largest Contentful Paint), have less than 100ms First Input Delay, and maintain Cumulative Layout Shift below 0.1. For every 100ms improvement in page load time, Amazon reports a 1% increase in revenue — a figure that, applied to their $500B+ annual revenue, represents billions of dollars in conversion value per 100 milliseconds of speed improvement.
Beyond page speed, user experience design directly impacts conversion rates in measurable ways. Product photography quality is a top-5 conversion driver — sites using high-quality imagery with multiple angles and zoom functionality convert at rates 30% higher than sites with single low-resolution images. Video product demonstrations increase conversion rates by 80–144% for complex products (electronics, furniture, fitness equipment). Customer reviews and social proof elements increase conversion rates by 270% for products with 5+ reviews vs products with none. Trust signals — security badges, money-back guarantees, free returns prominently displayed — increase conversion rates by 10–42% depending on product category and price point. The impact is greatest in categories with high-value or health-related products where consumer anxiety about purchase risk is highest.
Social Commerce Conversion Rates 2026 — TikTok Shop, Instagram, Pinterest
Social commerce — purchasing products directly within social media platforms without leaving the app — has emerged as one of the fastest-growing e-commerce channels with distinct conversion rate dynamics. TikTok Shop leads social commerce CVR in 2026 at approximately 3.5–4.5% for in-feed shopping content — significantly higher than traditional social media's 0.9% CVR. This is because TikTok's algorithm delivers product content to users with demonstrated interest signals, and the seamless in-app checkout eliminates redirect friction. Instagram Shopping averages approximately 1.2–2.5% CVR — lower than TikTok due to more static content formats, but higher than organic social traffic to external sites. Pinterest has an unusually high purchase intent audience — approximately 85% of weekly users have made a purchase inspired by Pinterest content — and achieves CVR of 1.5–3.0% for shoppable Pins.
Live commerce — real-time video shopping broadcasts — is driving extraordinary conversion rates in Asian markets and beginning to scale in Western markets. In China, live commerce accounts for approximately 20% of total e-commerce revenue and achieves average CVR of 8–12% during live sessions — 3–4x higher than standard e-commerce. This reflects the urgency created by limited-time offers, the entertainment value of live formats, and the direct Q&A capability that reduces purchase hesitation. Western platforms including TikTok Live, Instagram Live Shopping, and Amazon Live are all investing heavily in this format, with early data showing CVR of 3–6% — well above the global e-commerce average of 2.86%. For the broader digital advertising and platform context see our supermarkets in Mexico statistics and stock market terminology guide.
Conversion Rate Optimisation — Key Statistics & Impact Data 2026
Conversion Rate Optimisation (CRO) is the practice of systematically improving websites to increase the percentage of visitors who convert. A 1% improvement in conversion rate — from 3% to 4% — represents a 33% increase in revenue from existing traffic with zero increase in customer acquisition costs. This makes CRO one of the highest-ROI marketing investments available. Companies running structured A/B testing programmes achieve 50%+ higher conversion rates over three years versus those without. The average ROI on CRO investment is reported at 223% in 2026 (VWO benchmark report). Checkout optimisation remains the highest-ROI CRO focus area: reducing checkout form fields from 14 to 7 increases completion rates by 20–30%. Page speed is the second-highest impact factor — a 1-second delay in mobile page load time reduces conversion rates by 20%. For the financial and stock market context of digital commerce see our global financial markets and Nasdaq statistics.
Approximately 70.19% of online shopping carts are abandoned globally before purchase completion. On mobile the rate rises to 85%. The primary reasons: unexpected shipping costs (48%), forced account creation (24%), too-long checkout process (22%), and payment security concerns (18%). Recovering just 5% of abandoned carts through email remarketing (average open rate 45%, click rate 21%) adds significant revenue — cart abandonment email sequences have an average CVR of 5.6% on re-engagement.
AI-Driven Personalisation — The Next CVR Frontier
Artificial intelligence is rapidly becoming the most powerful lever for conversion rate improvement available to e-commerce businesses. AI-powered personalisation — delivering individualised product recommendations, pricing, content, and promotional offers based on real-time behavioural signals — consistently delivers CVR improvements of 15–35% above baseline for sites that implement it well. The leading AI personalisation platforms (Dynamic Yield acquired by Mastercard, Bloomreach, Nosto, Klevu, and the native AI capabilities in Salesforce Commerce Cloud and Adobe Commerce) use machine learning models trained on millions of customer interactions to predict which products each visitor is most likely to purchase and surface them at the optimal moment in the browsing journey.
Personalised search results — where the product search results page is re-ranked based on individual user behaviour — improves CVR from search by 30–50% compared to static relevance-ranked results. Personalised email campaigns (dynamic content blocks that change per recipient based on purchase history and browsing behaviour) achieve open rates of 29% vs 17% for static campaigns and CVR of 7.4% vs 5.3% for non-personalised emails. AI-powered chat and shopping assistants are also emerging as significant CVR drivers — sites with AI chat support achieve 23% higher conversion rates as the assistant reduces purchase hesitation by answering product questions instantly. The ROI case for AI personalisation is now sufficiently proven that it has become a standard capability for any e-commerce operation above approximately $10 million in annual revenue. Retailers that have not yet invested in AI personalisation are increasingly at a structural disadvantage versus competitors who have — the CVR gap between AI-enabled and non-AI-enabled sites continues to widen year-on-year. For the broader AI market context see our AI market size worldwide statistics.
Frequently Asked Questions — Conversion Rate Benchmarks
The global average e-commerce conversion rate is 2.86% in 2026. Food and grocery leads at 7%+, financial services at 5.5% (lead gen), health and beauty at 3.3%, fashion at 2.2%, and consumer electronics at 1.4%. Top 10% of all e-commerce sites achieve 11%+ CVR.
Food and grocery delivery leads with 5.5–7%+ CVR due to habitual purchasing, subscription models, and high repeat purchase rates. Financial services leads for lead generation conversion at up to 11% (insurance comparison sites).
Desktop converts at 4.14% vs mobile at 1.82% in 2026. Mobile drives 72% of all traffic but only 49% of revenue. The gap is closing — mobile CVR has grown 35% in three years driven by one-click checkout (Apple Pay, Google Pay, Shop Pay) which boosts mobile CVR by up to 80%.
Above 3.5% is generally considered good for e-commerce in 2026. Top 25% of sites achieve 5%+. Top 10% achieve 11%+. Always benchmark against your specific industry vertical — a 2% CVR in consumer electronics is above average, while 2% in food delivery would be very poor.
Email marketing converts at 5.3% — the highest of any digital channel. Direct traffic is second at 3.9%. Paid search averages 2.9%. Organic search 2.4%. Organic social converts at just 0.9% as it is primarily discovery-oriented rather than purchase-intent traffic.
The global average cart abandonment rate is 70.19% in 2026 — rising to 85% on mobile. The top reasons: unexpected shipping costs (48%), forced account creation (24%), long checkout process (22%), and payment security concerns (18%). Cart abandonment email sequences achieve 5.6% CVR on re-engagement — making recovery campaigns one of the highest-ROI email activities.
A 1-second delay in page load time reduces conversion rates by 20% on mobile. A site loading in 1 second converts 3x better than one loading in 5 seconds. Amazon reports every 100ms improvement in load time increases revenue by 1%. Top-converting e-commerce sites load in under 2.5 seconds on mobile (Google Core Web Vitals benchmark).
Primary: IRP Commerce — Industry Conversion Rate Benchmarks 2026
Primary: Adobe Digital Economy Index — Q4 2025
Supporting: Salesforce Shopping Index 2025 · Contentsquare Digital Experience Report 2026 · WordStream Paid Search Benchmarks
